Editorial Infographics for Médias24
These nineteen graphics come from my editorial work for Médias24. A rail diagram follows a journey through Casablanca–Settat, a seating chart explains membership of the UN Security Council, and two calendars show how lambing seasons differ between sheep breeds. Each story starts with a question and uses a visual form that helps readers answer it.
Education · International affairs · Transport and city life · Water and energy · Agriculture · Defense industry · Investigations
Select any graphic to open the full-size artwork.
Education
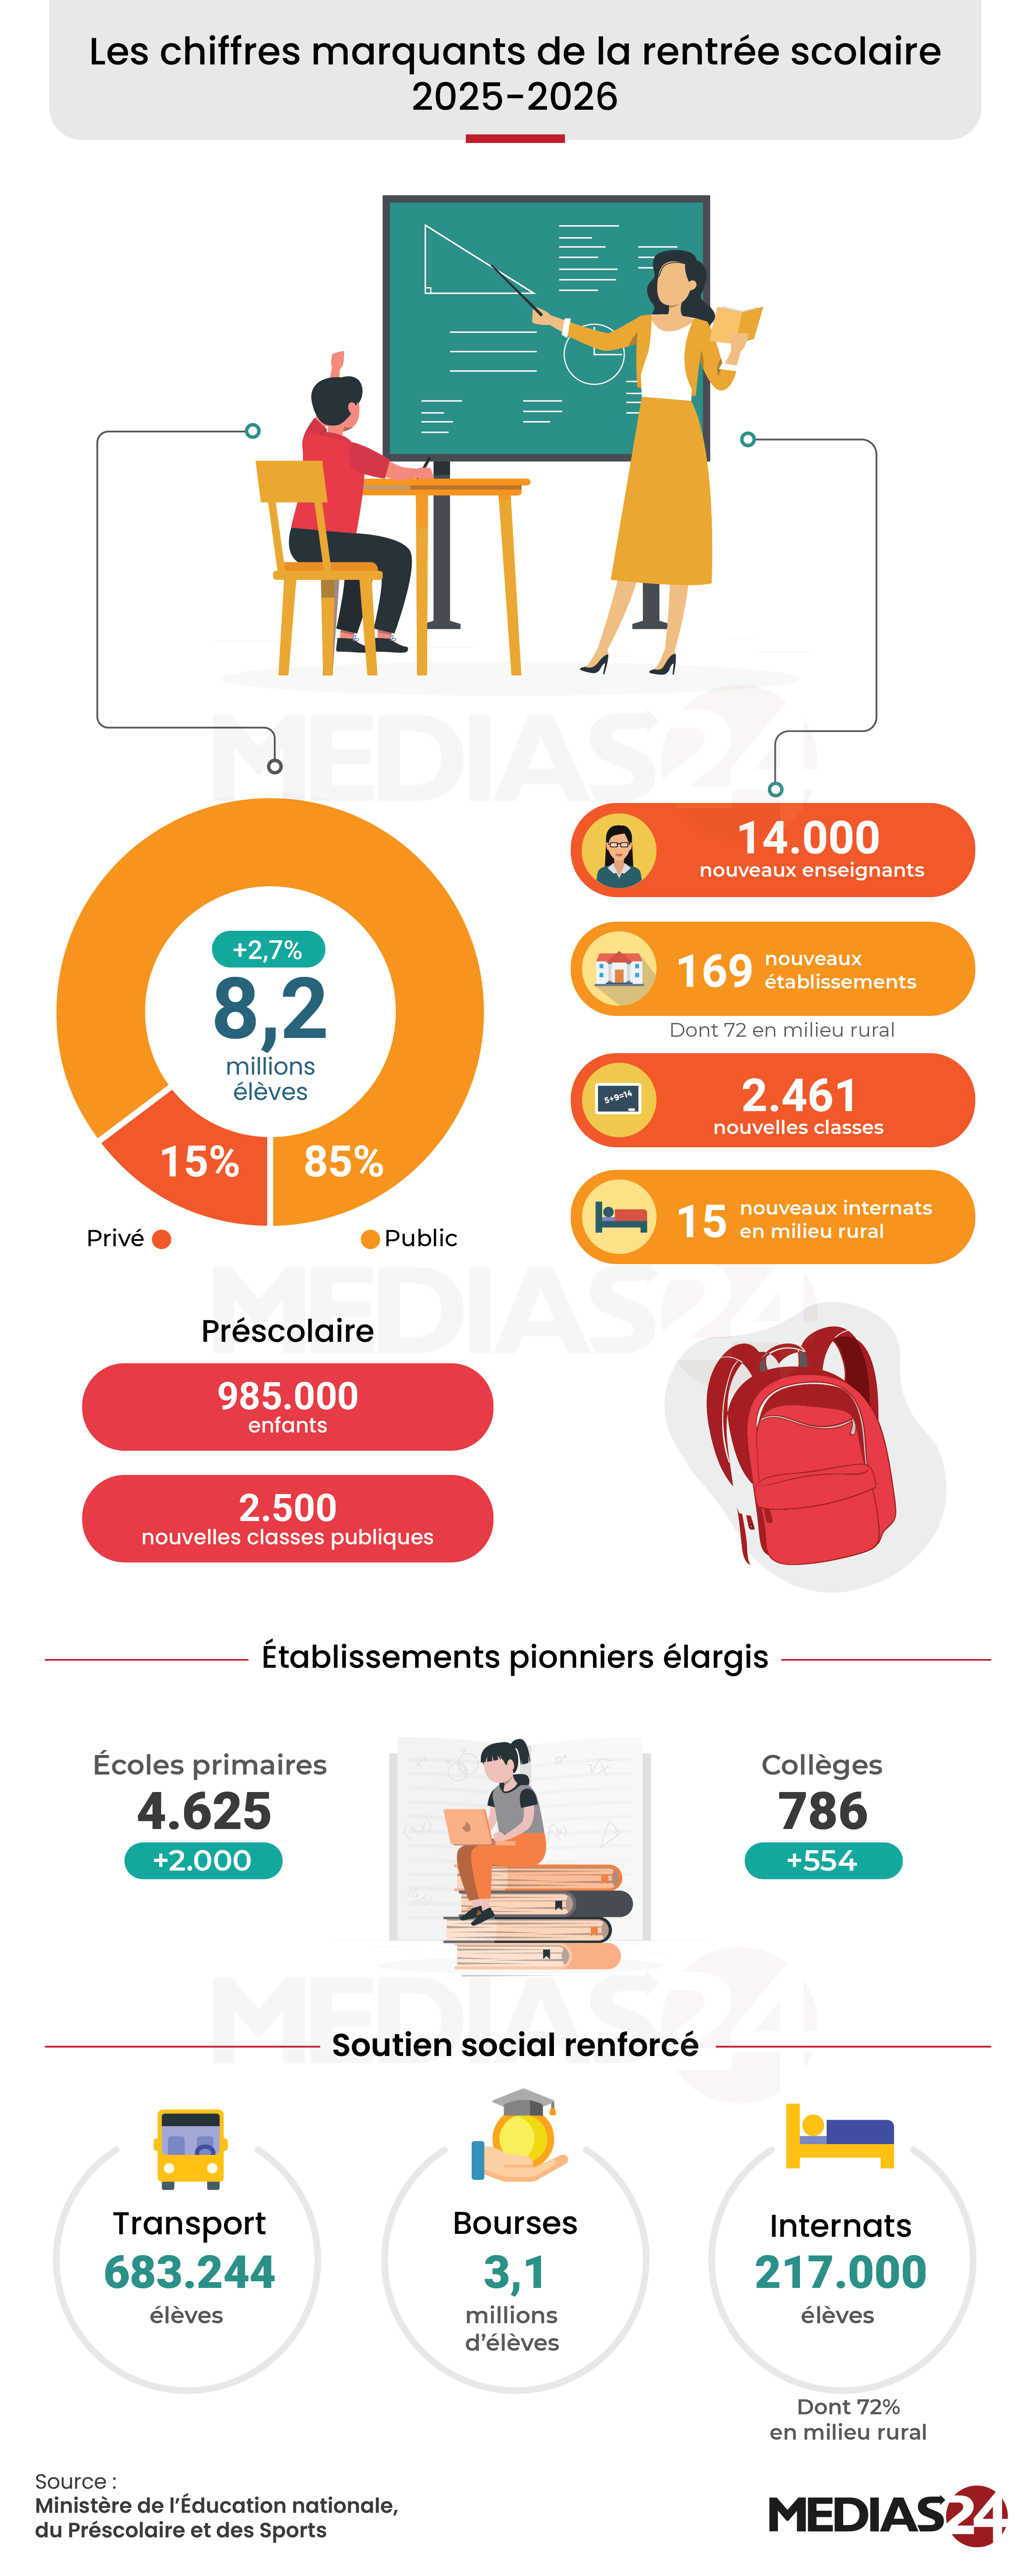
The 2025–2026 school year in Morocco
The enrolment chart starts with 8.2 million pupils and shows the split between public and private schools. Below it, a second set of figures follows the journey to school through transport, grants and boarding places.
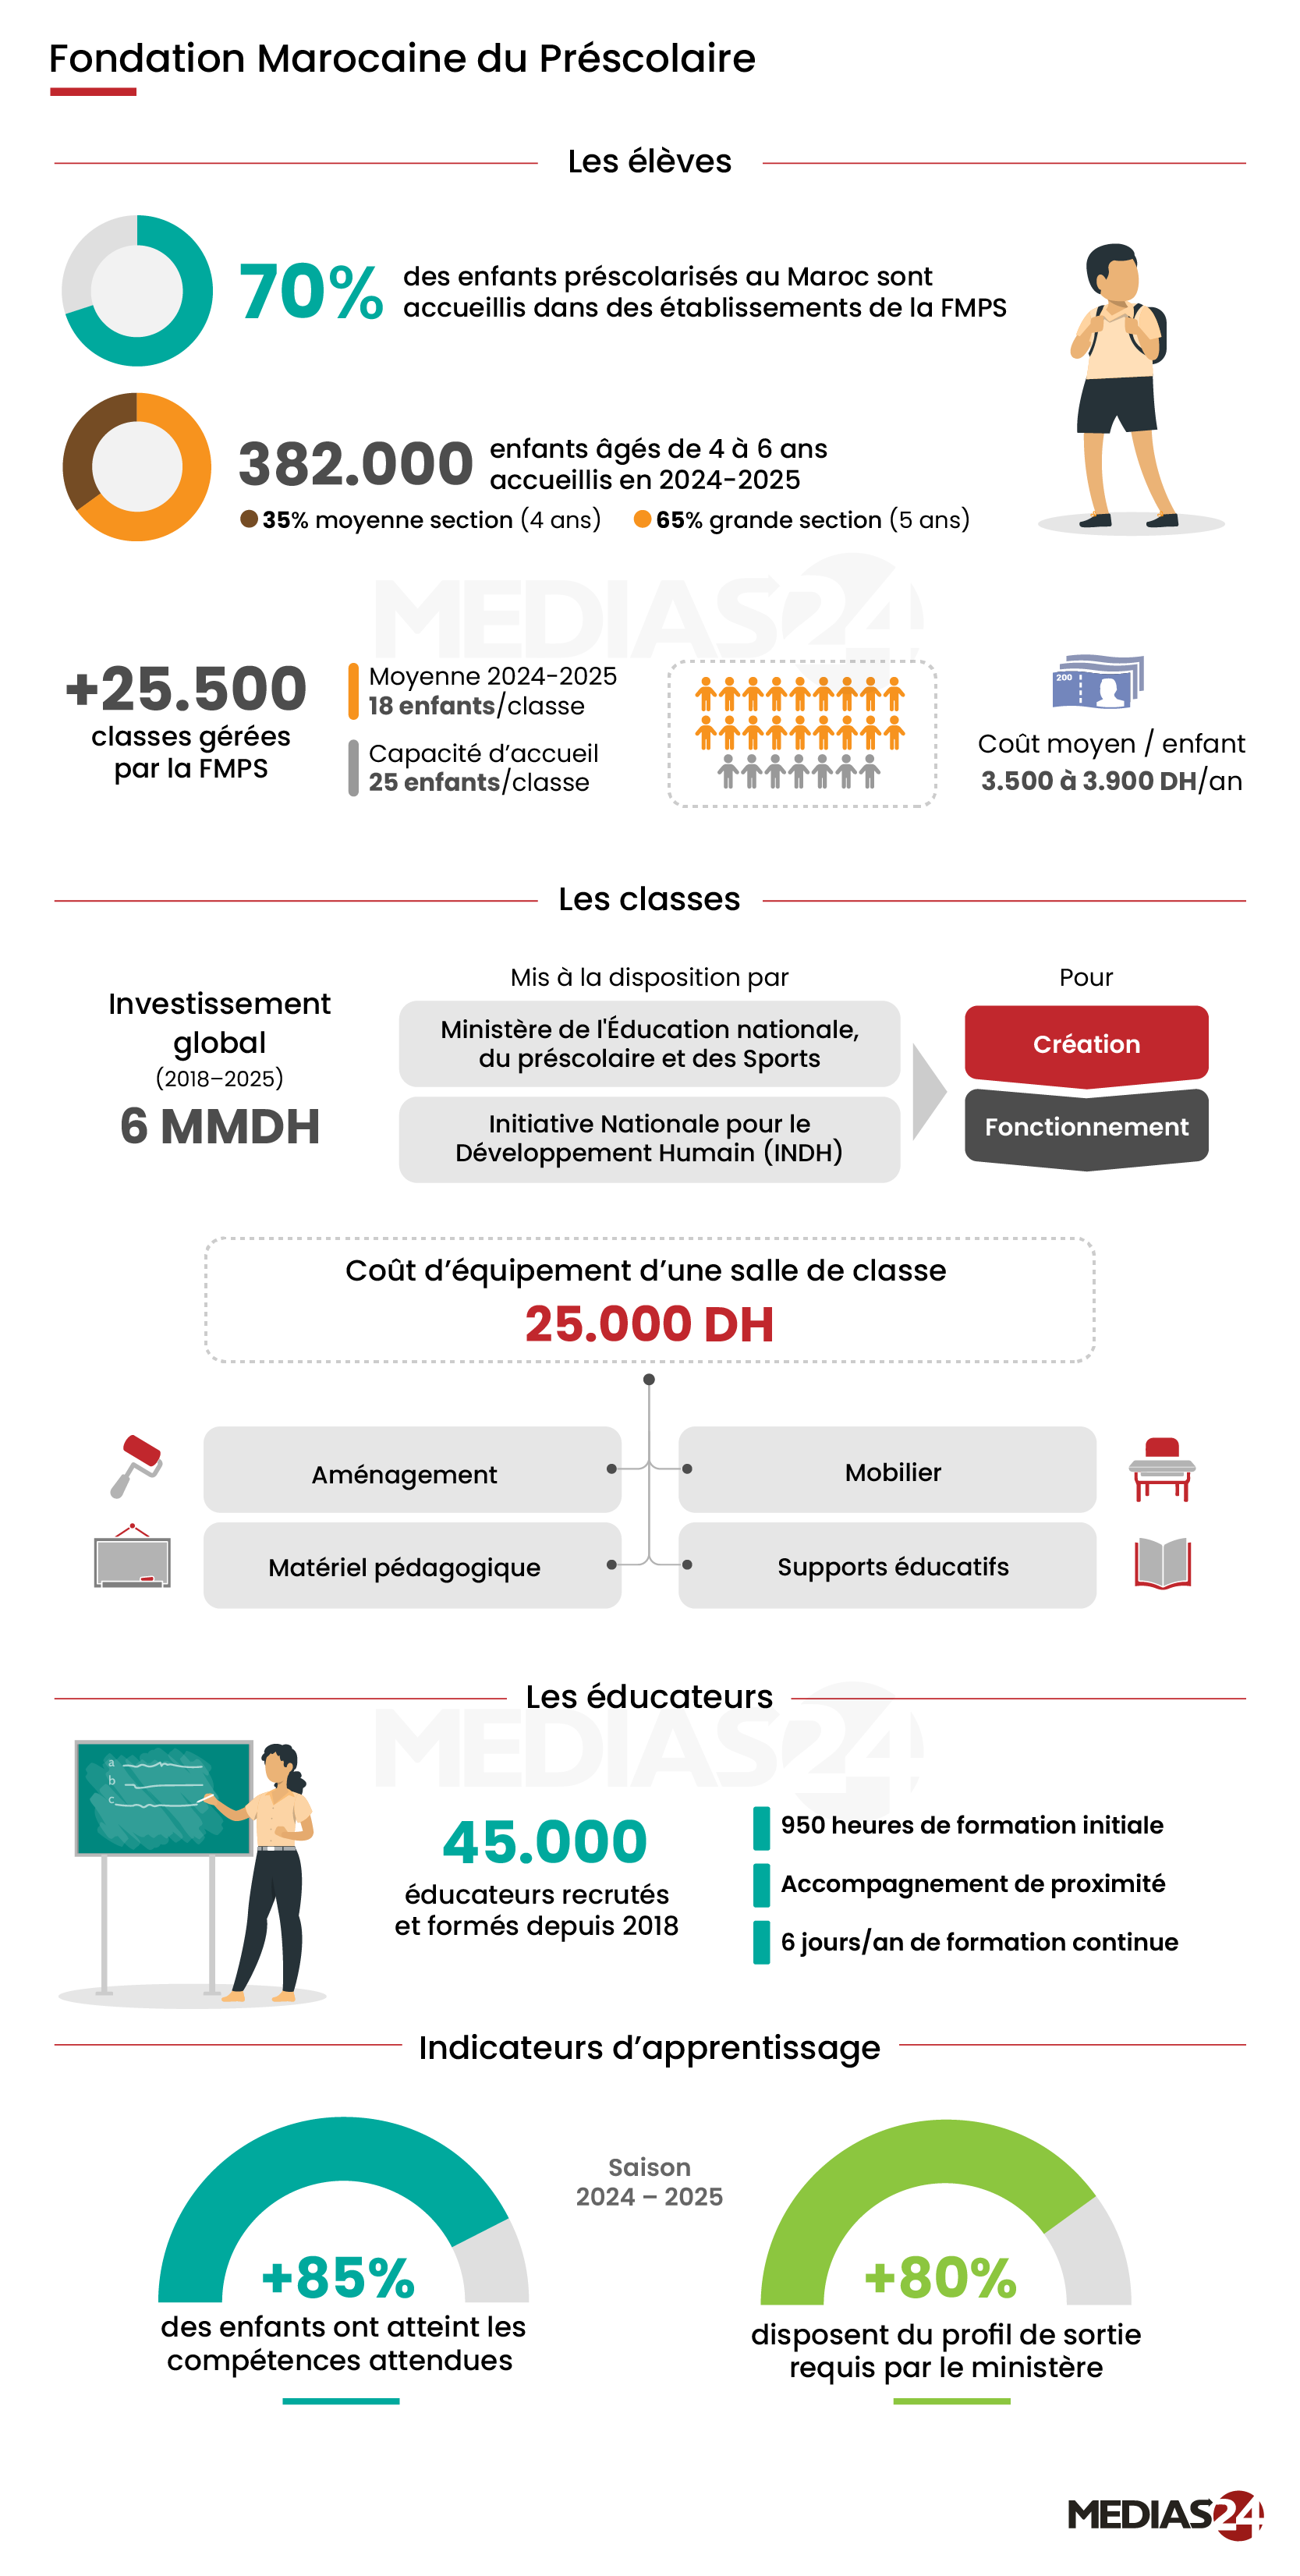
Inside Morocco’s preschool network
A classroom is the unit of comparison here. Readers can move from the number of children in a class to the cost of equipping the room, then see how the foundation trains its educators.
International affairs
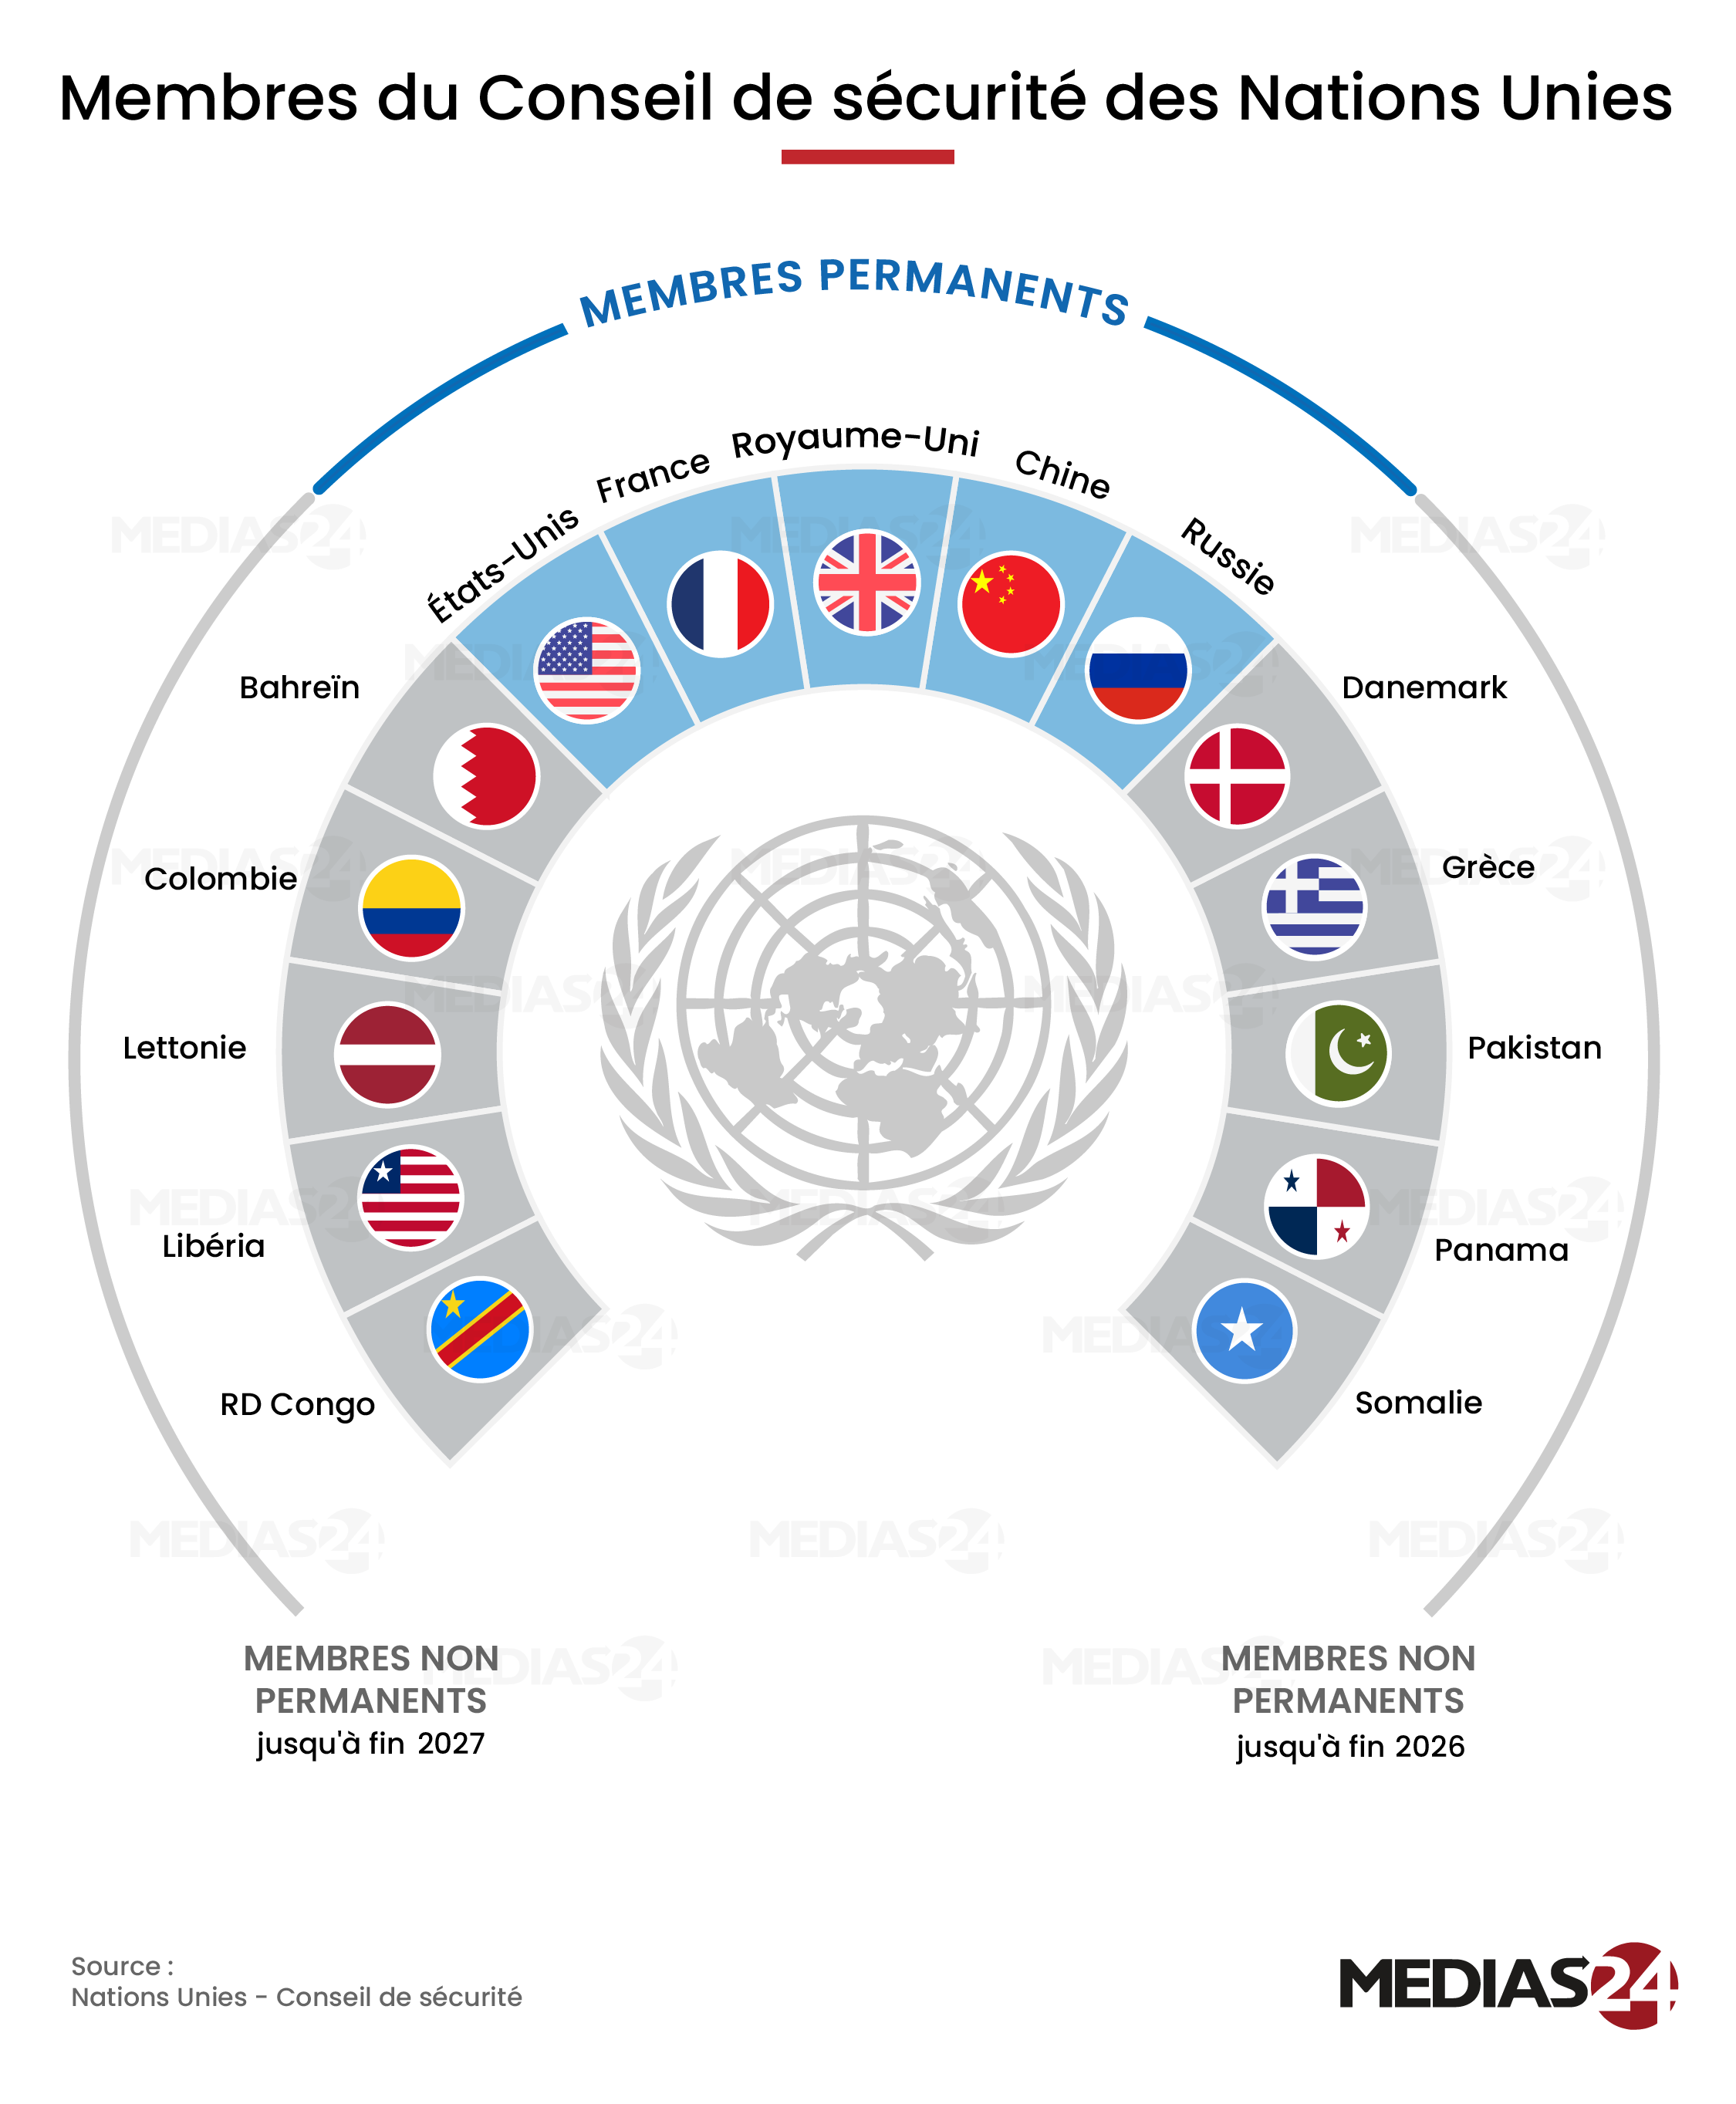
Who sits on the UN Security Council in 2026?
The five permanent seats occupy the blue arc. On either side, the elected members are grouped by the year their terms end, so readers can see which seats change together.
Transport and city life
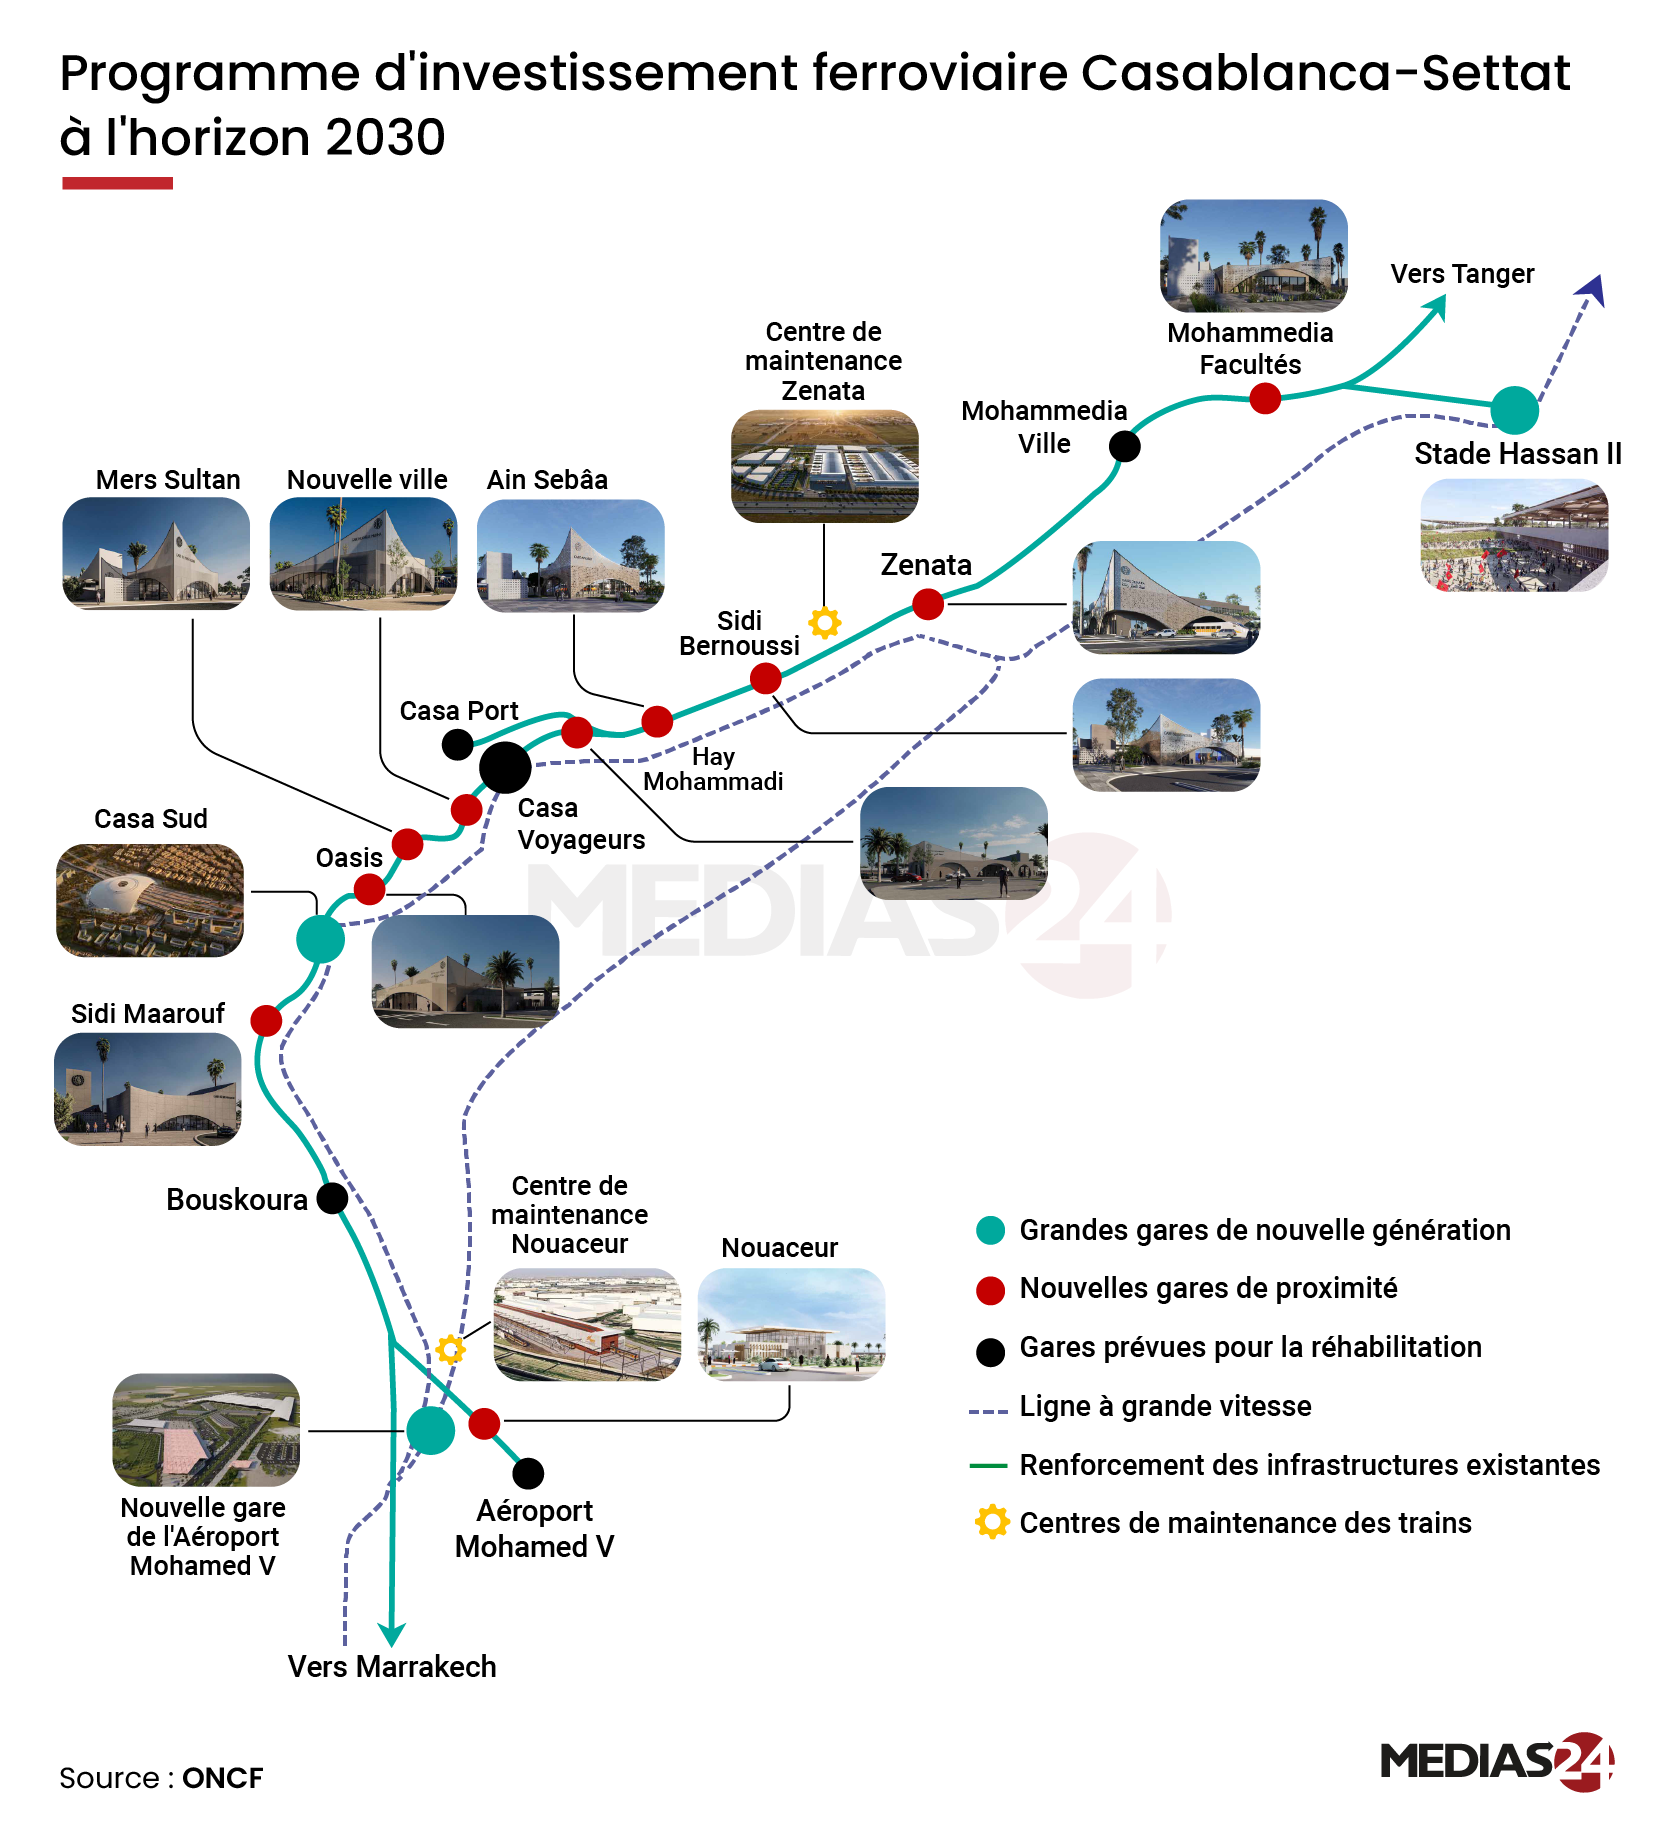
Casablanca–Settat rail investment to 2030
Station illustrations give each stop a recognizable landmark. Along the route, colored markers distinguish planned stations from those scheduled for renovation.
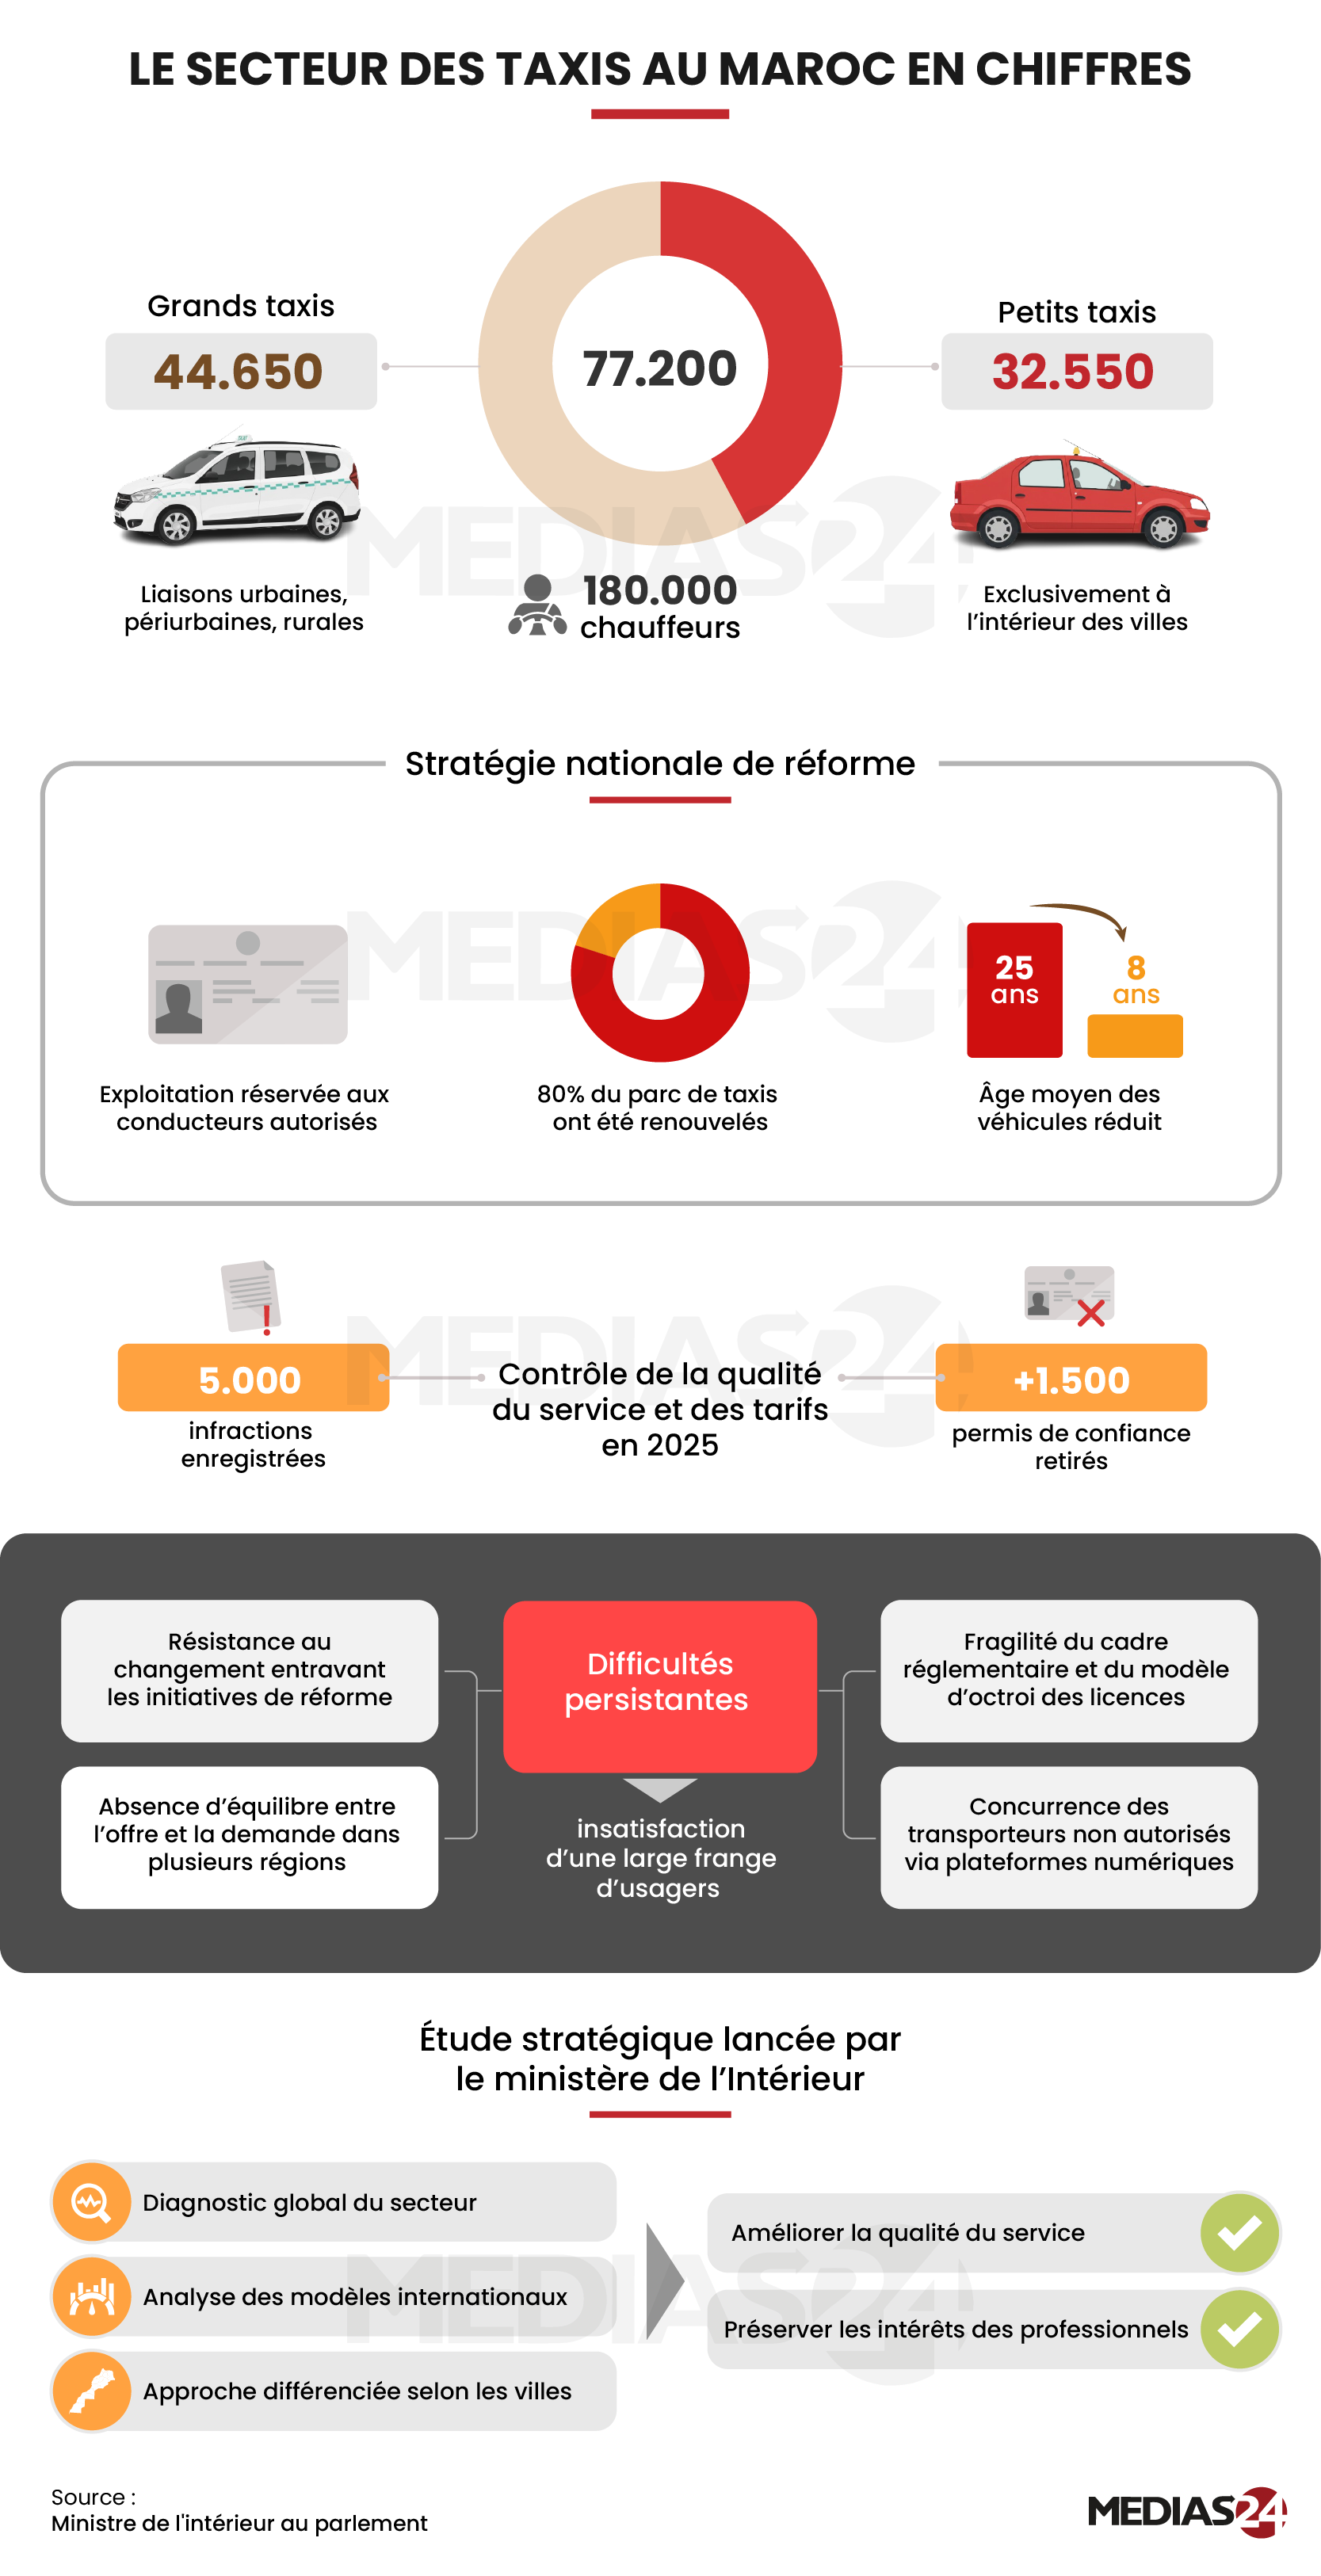
Morocco’s taxi sector in figures
Two familiar vehicles introduce the figures: grands taxis serve urban, suburban and rural routes, while petits taxis operate within cities. The panels below follow the fleet through renewal and service checks.
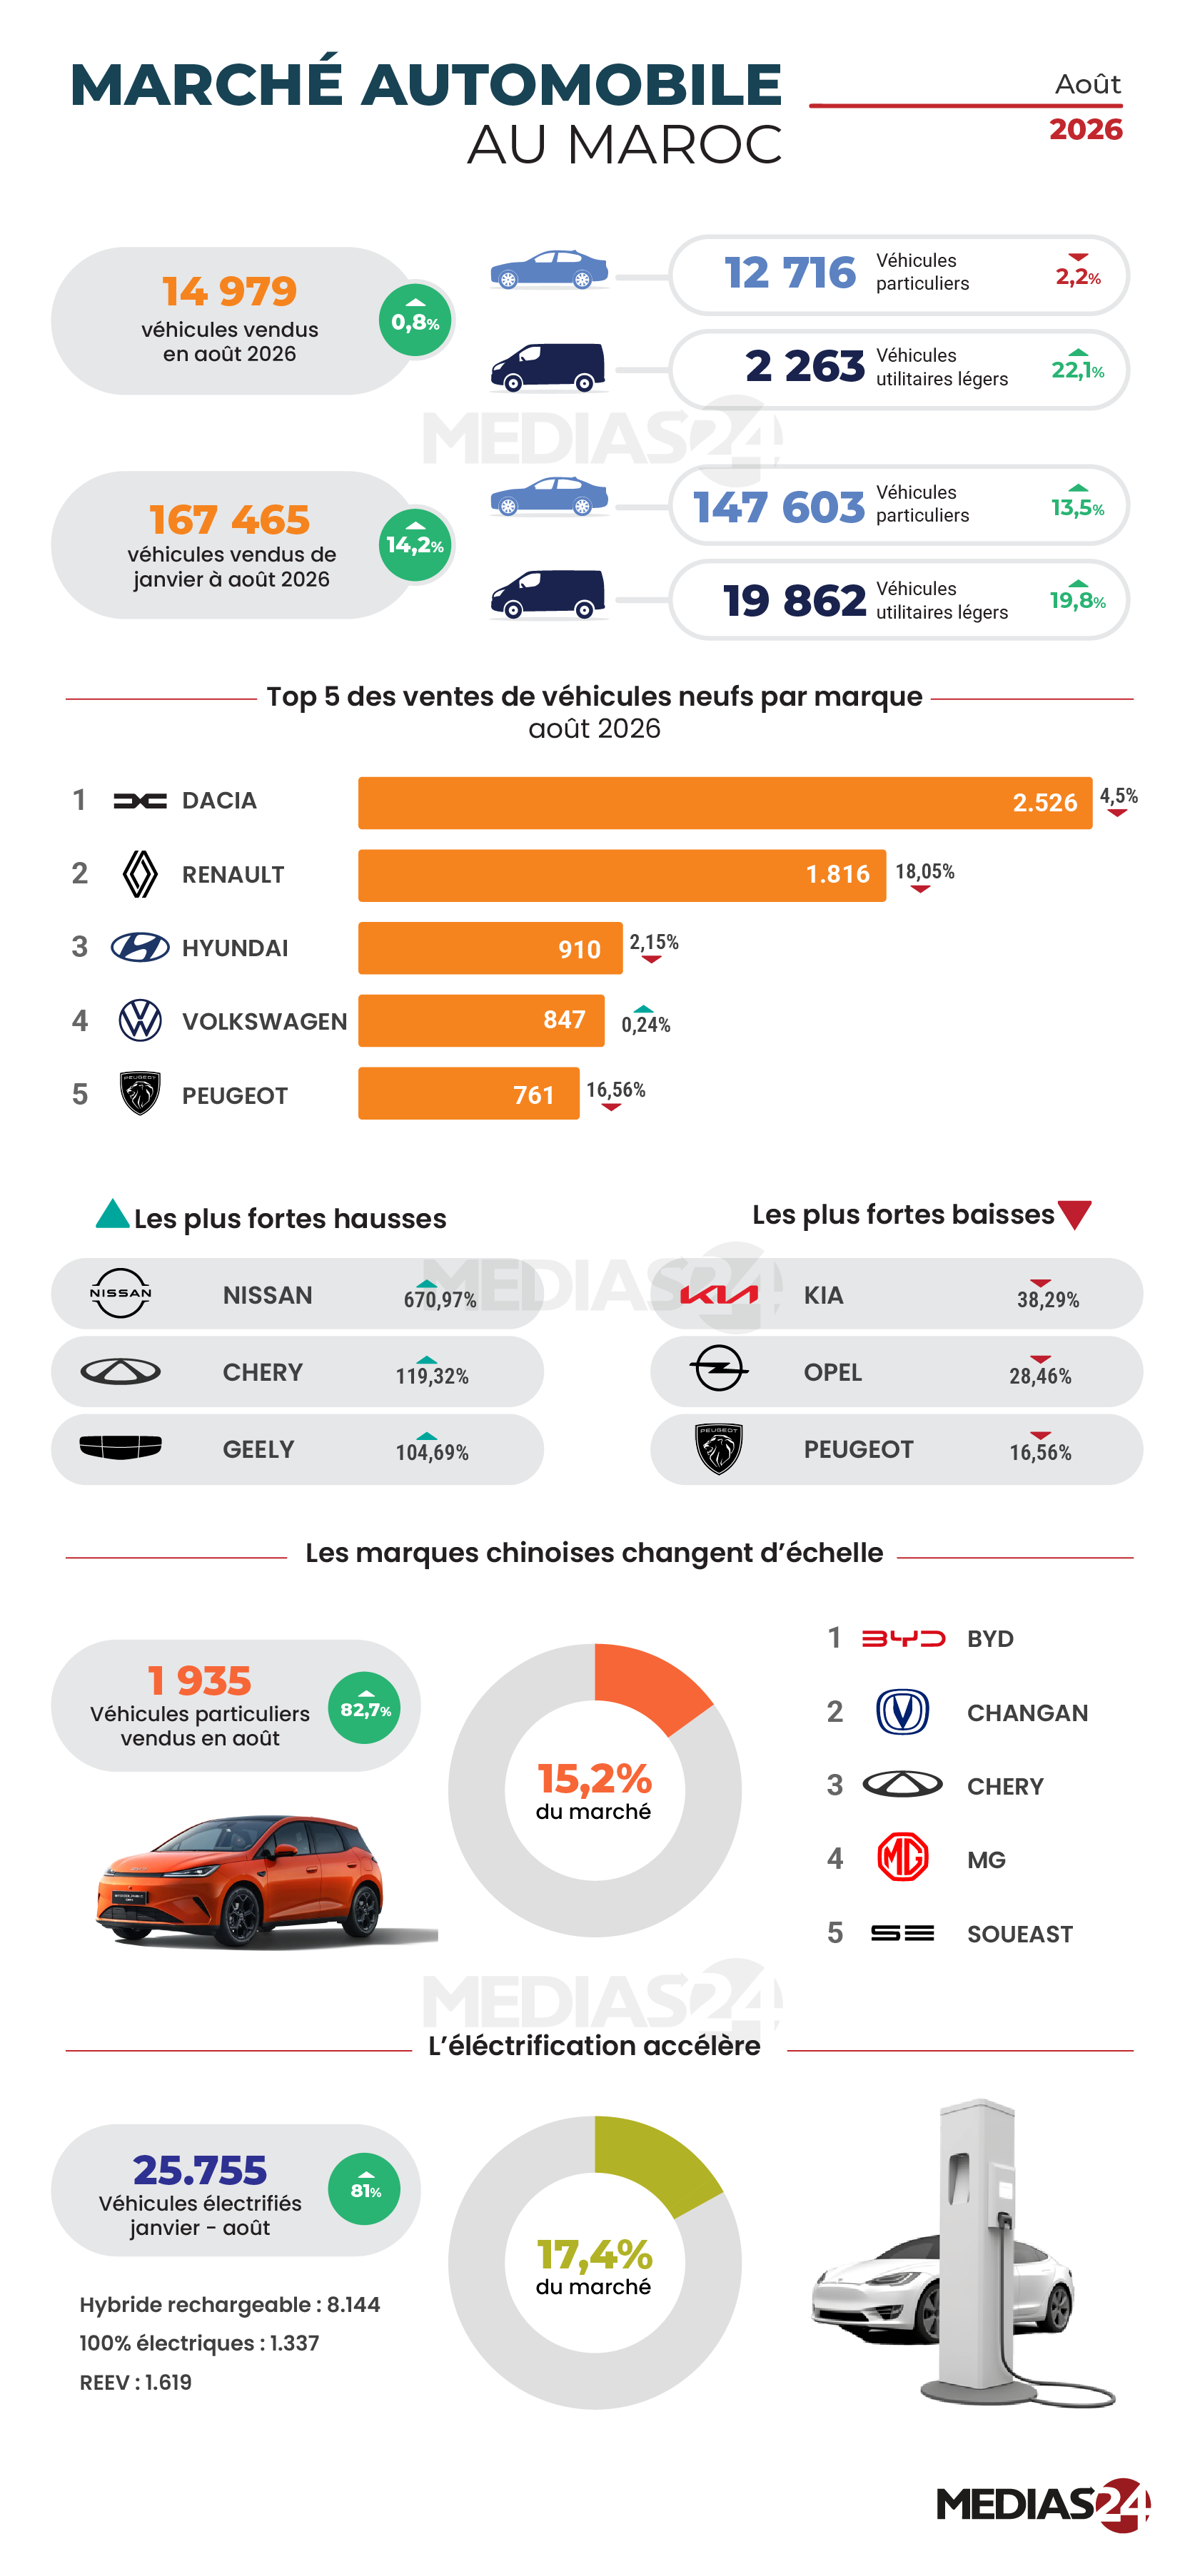
Morocco’s vehicle market in August 2026
Two rows separate August sales from the January–August total. A bar chart ranks the five best-selling brands that month, and the panels below examine Chinese brands and electrified vehicles.
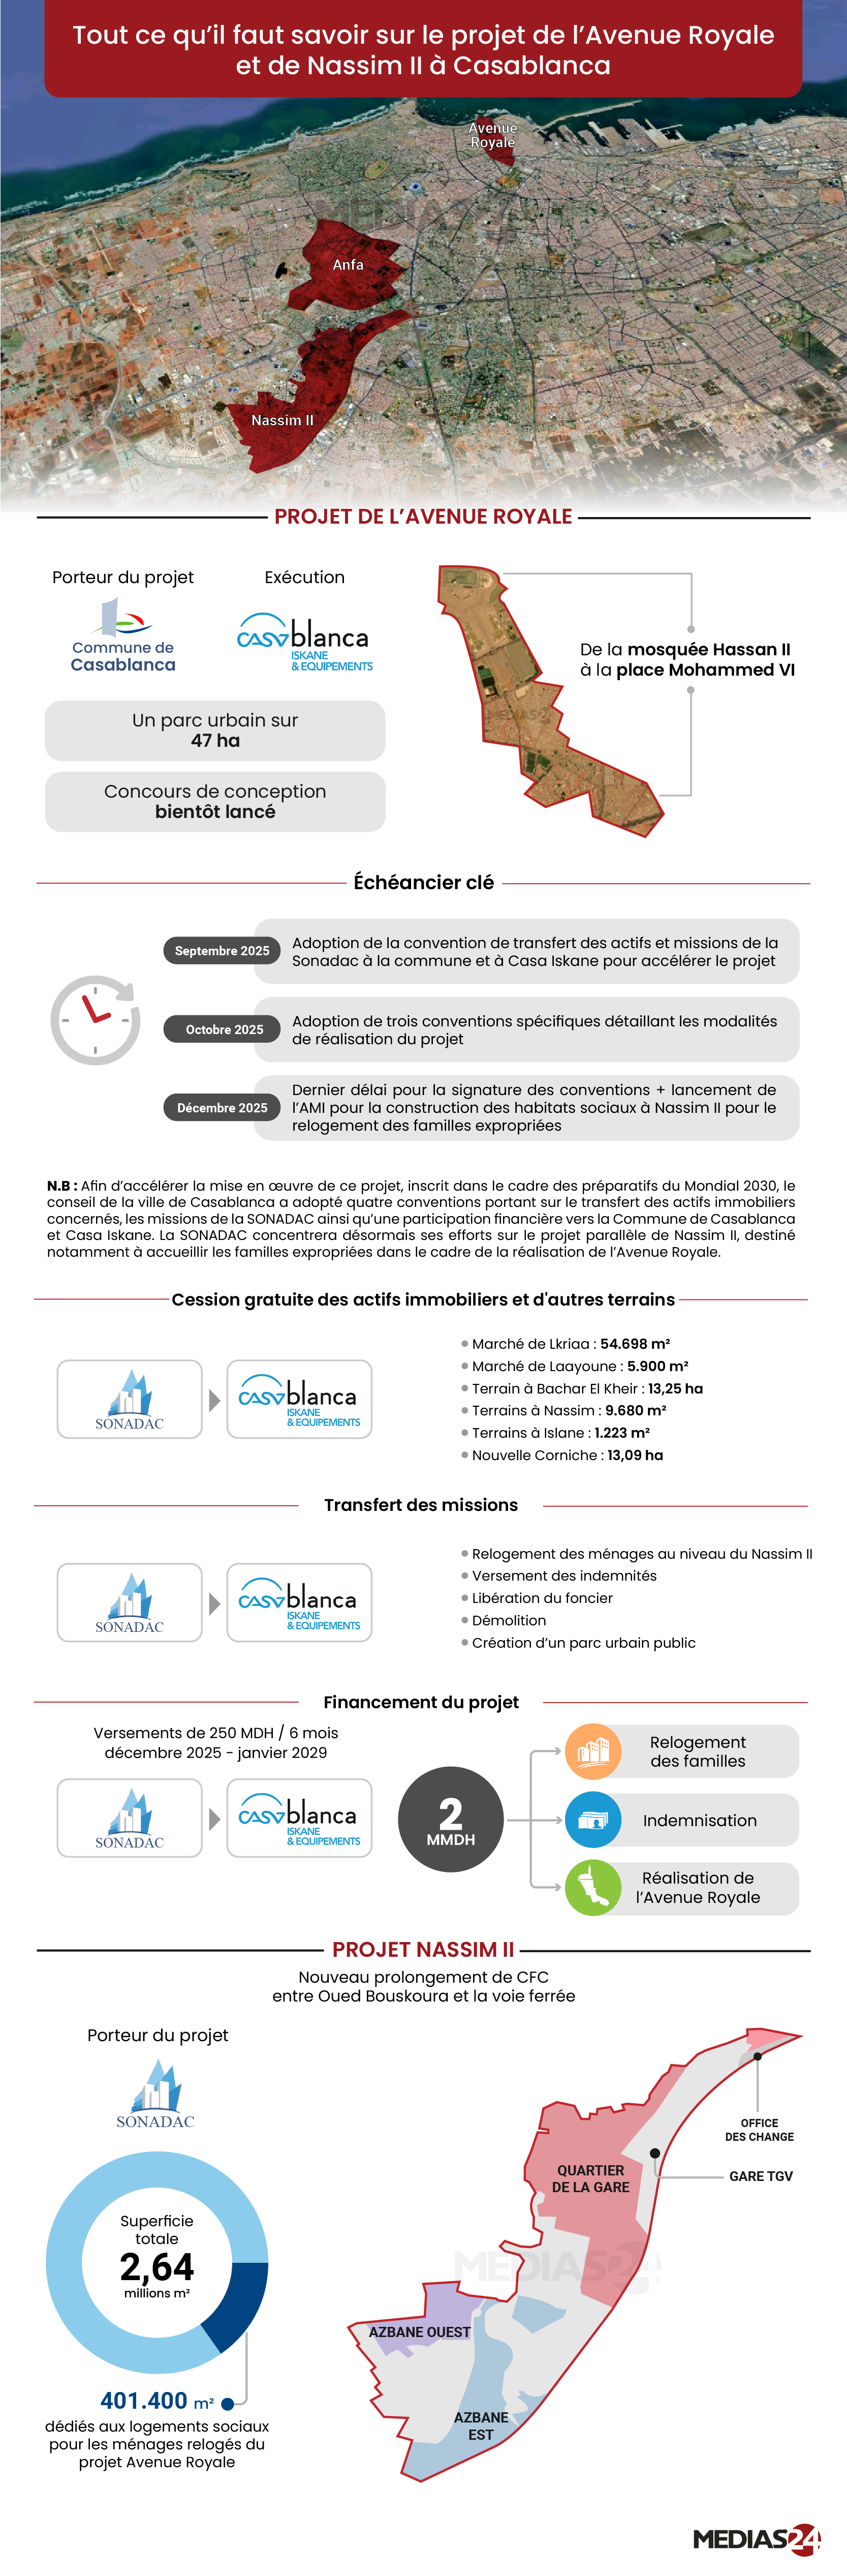
Avenue Royale and Nassim II
The satellite view locates both sites within Casablanca. A closer view of each project connects its footprint to the schedule, financing and plans for rehousing families.
Property prices across Casablanca
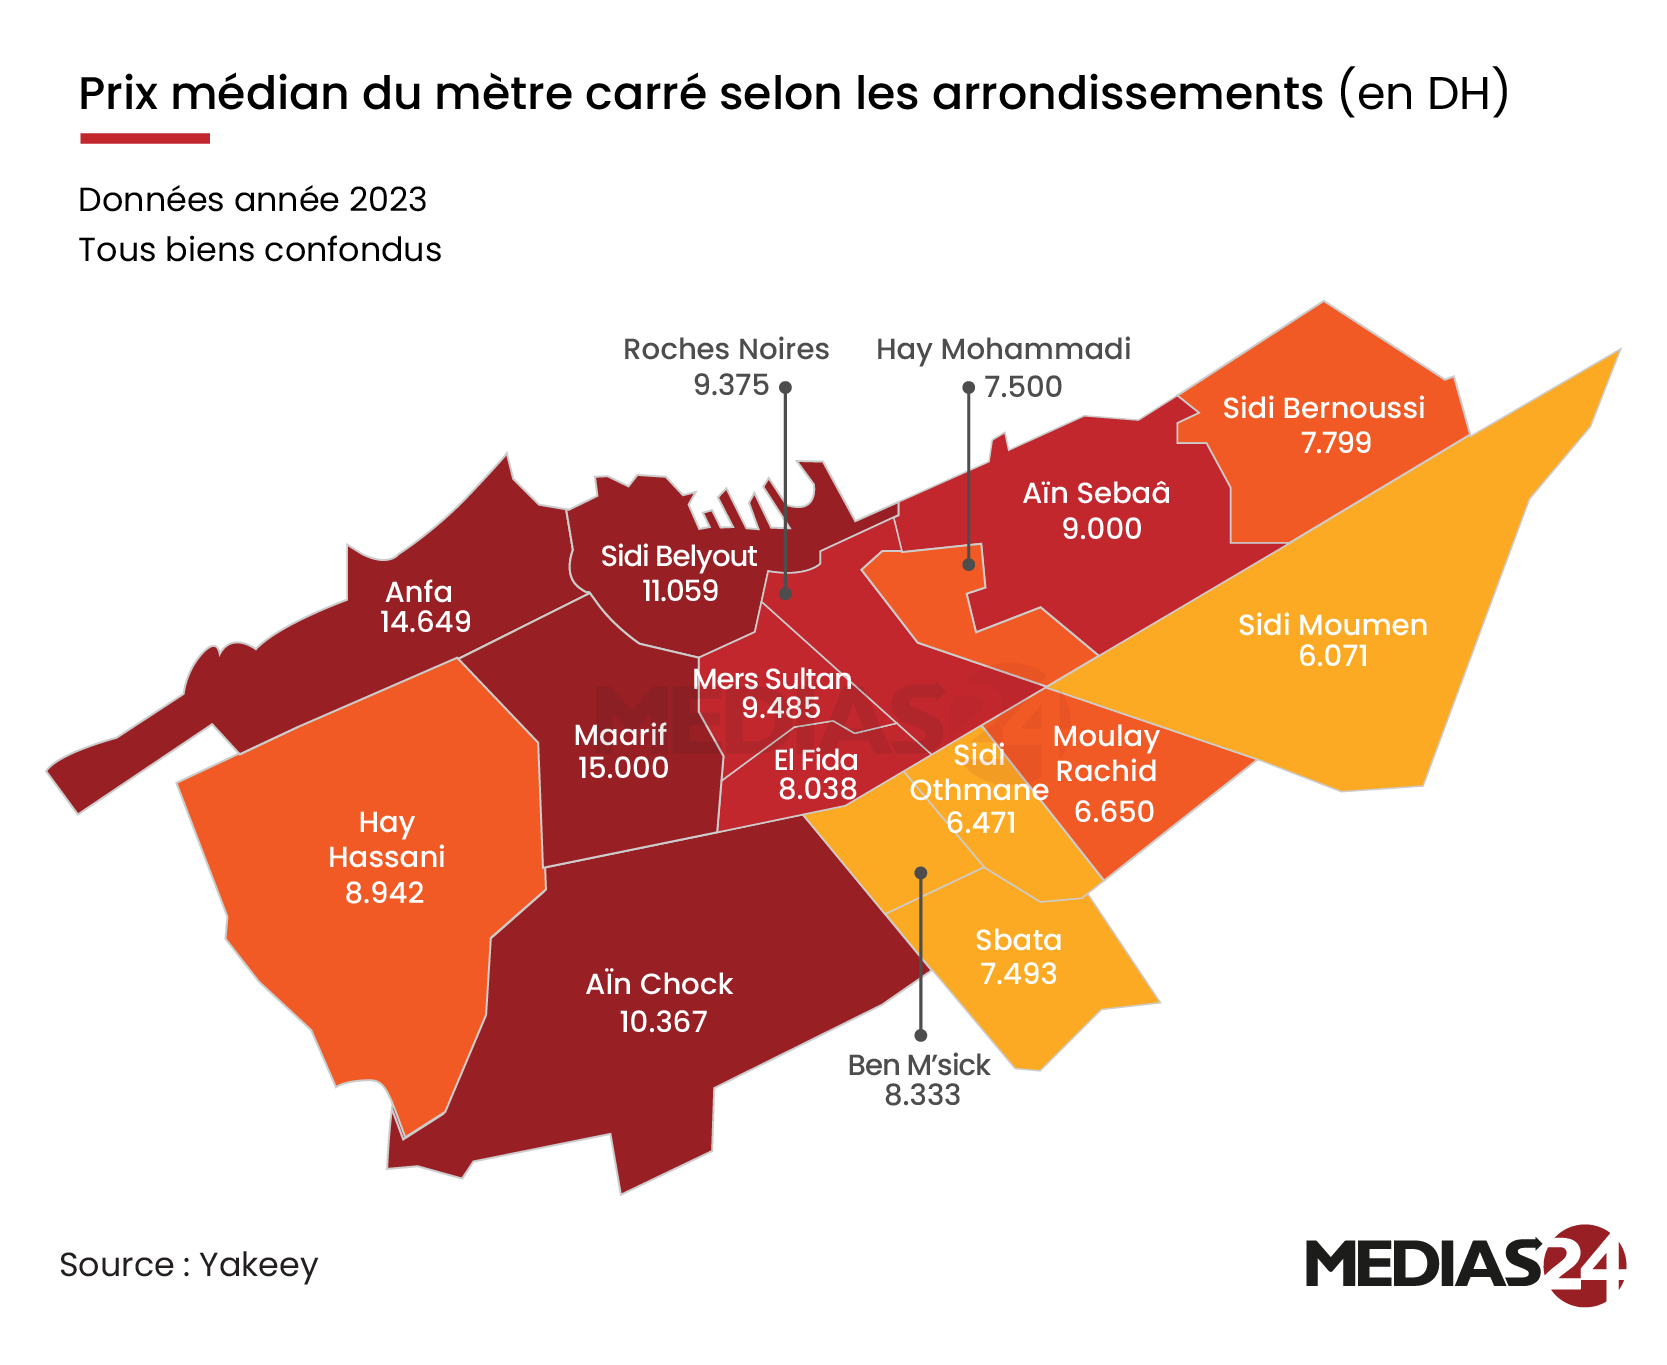
District boundaries give the price data a familiar shape. Color reveals the broad pattern, while the labels let readers compare the median price per square metre in two specific districts.
Water and energy
Renewable energy potential in Morocco
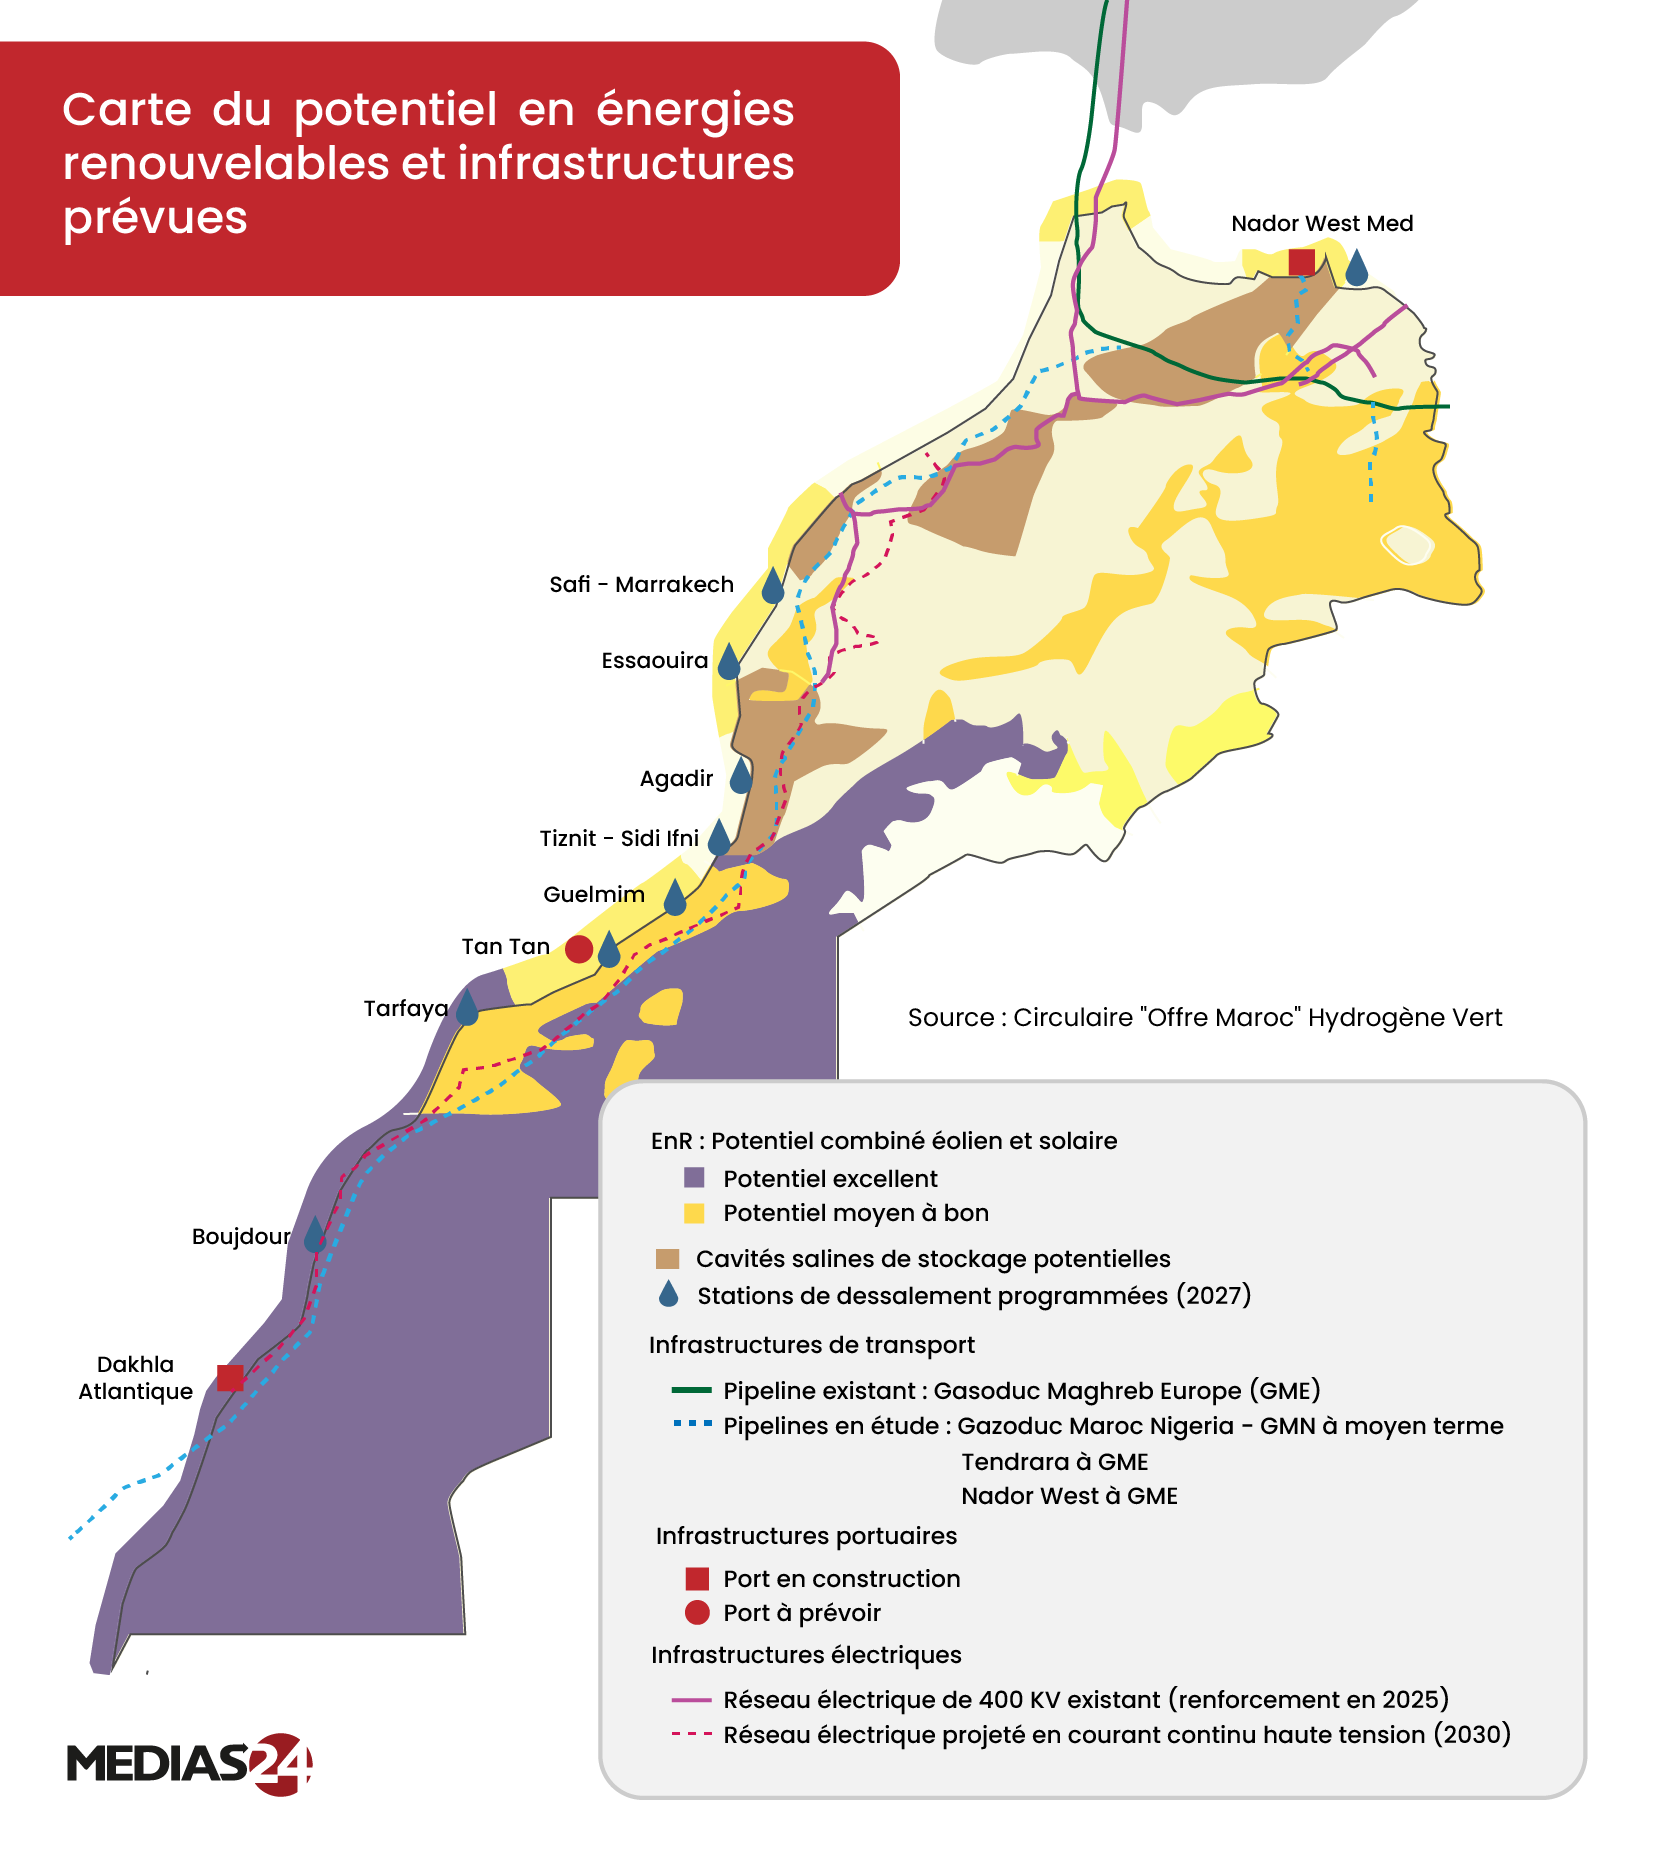
Wind and solar zones share a map with ports, pipelines and electricity links. The overlays show where a promising energy resource sits close to the infrastructure needed to use it.
Morocco’s dams since 1999
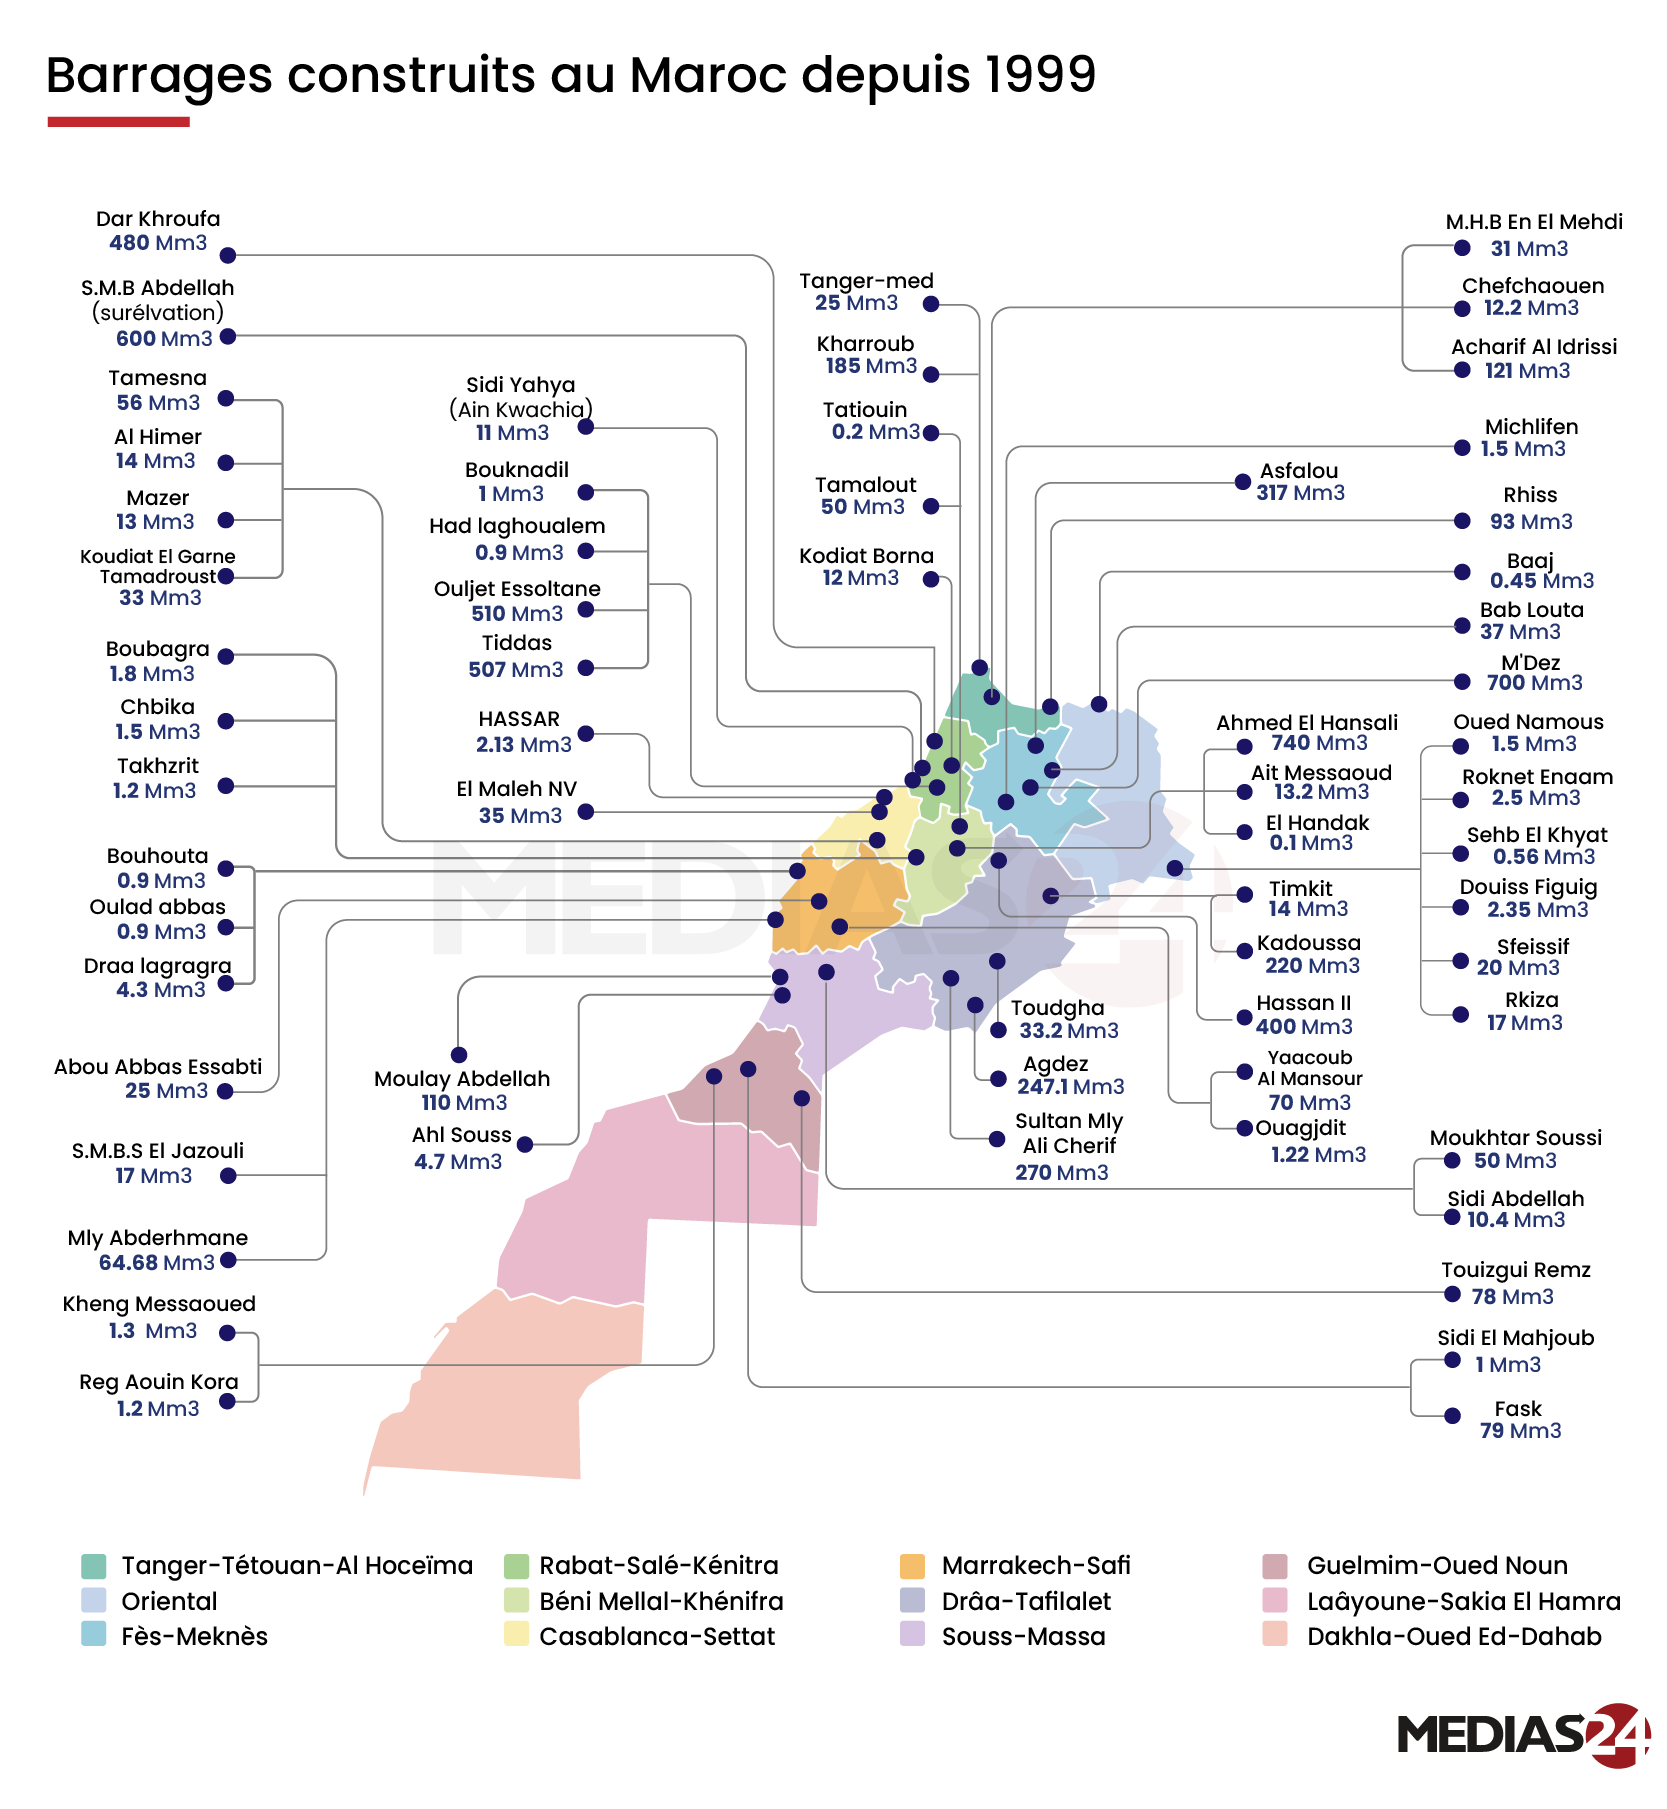
The map gives each dam a dot. Fine lines carry its name and capacity to the margins, leaving even the closely spaced sites in the north visible.
Which Moroccan reservoirs were full on 8 January 2026?
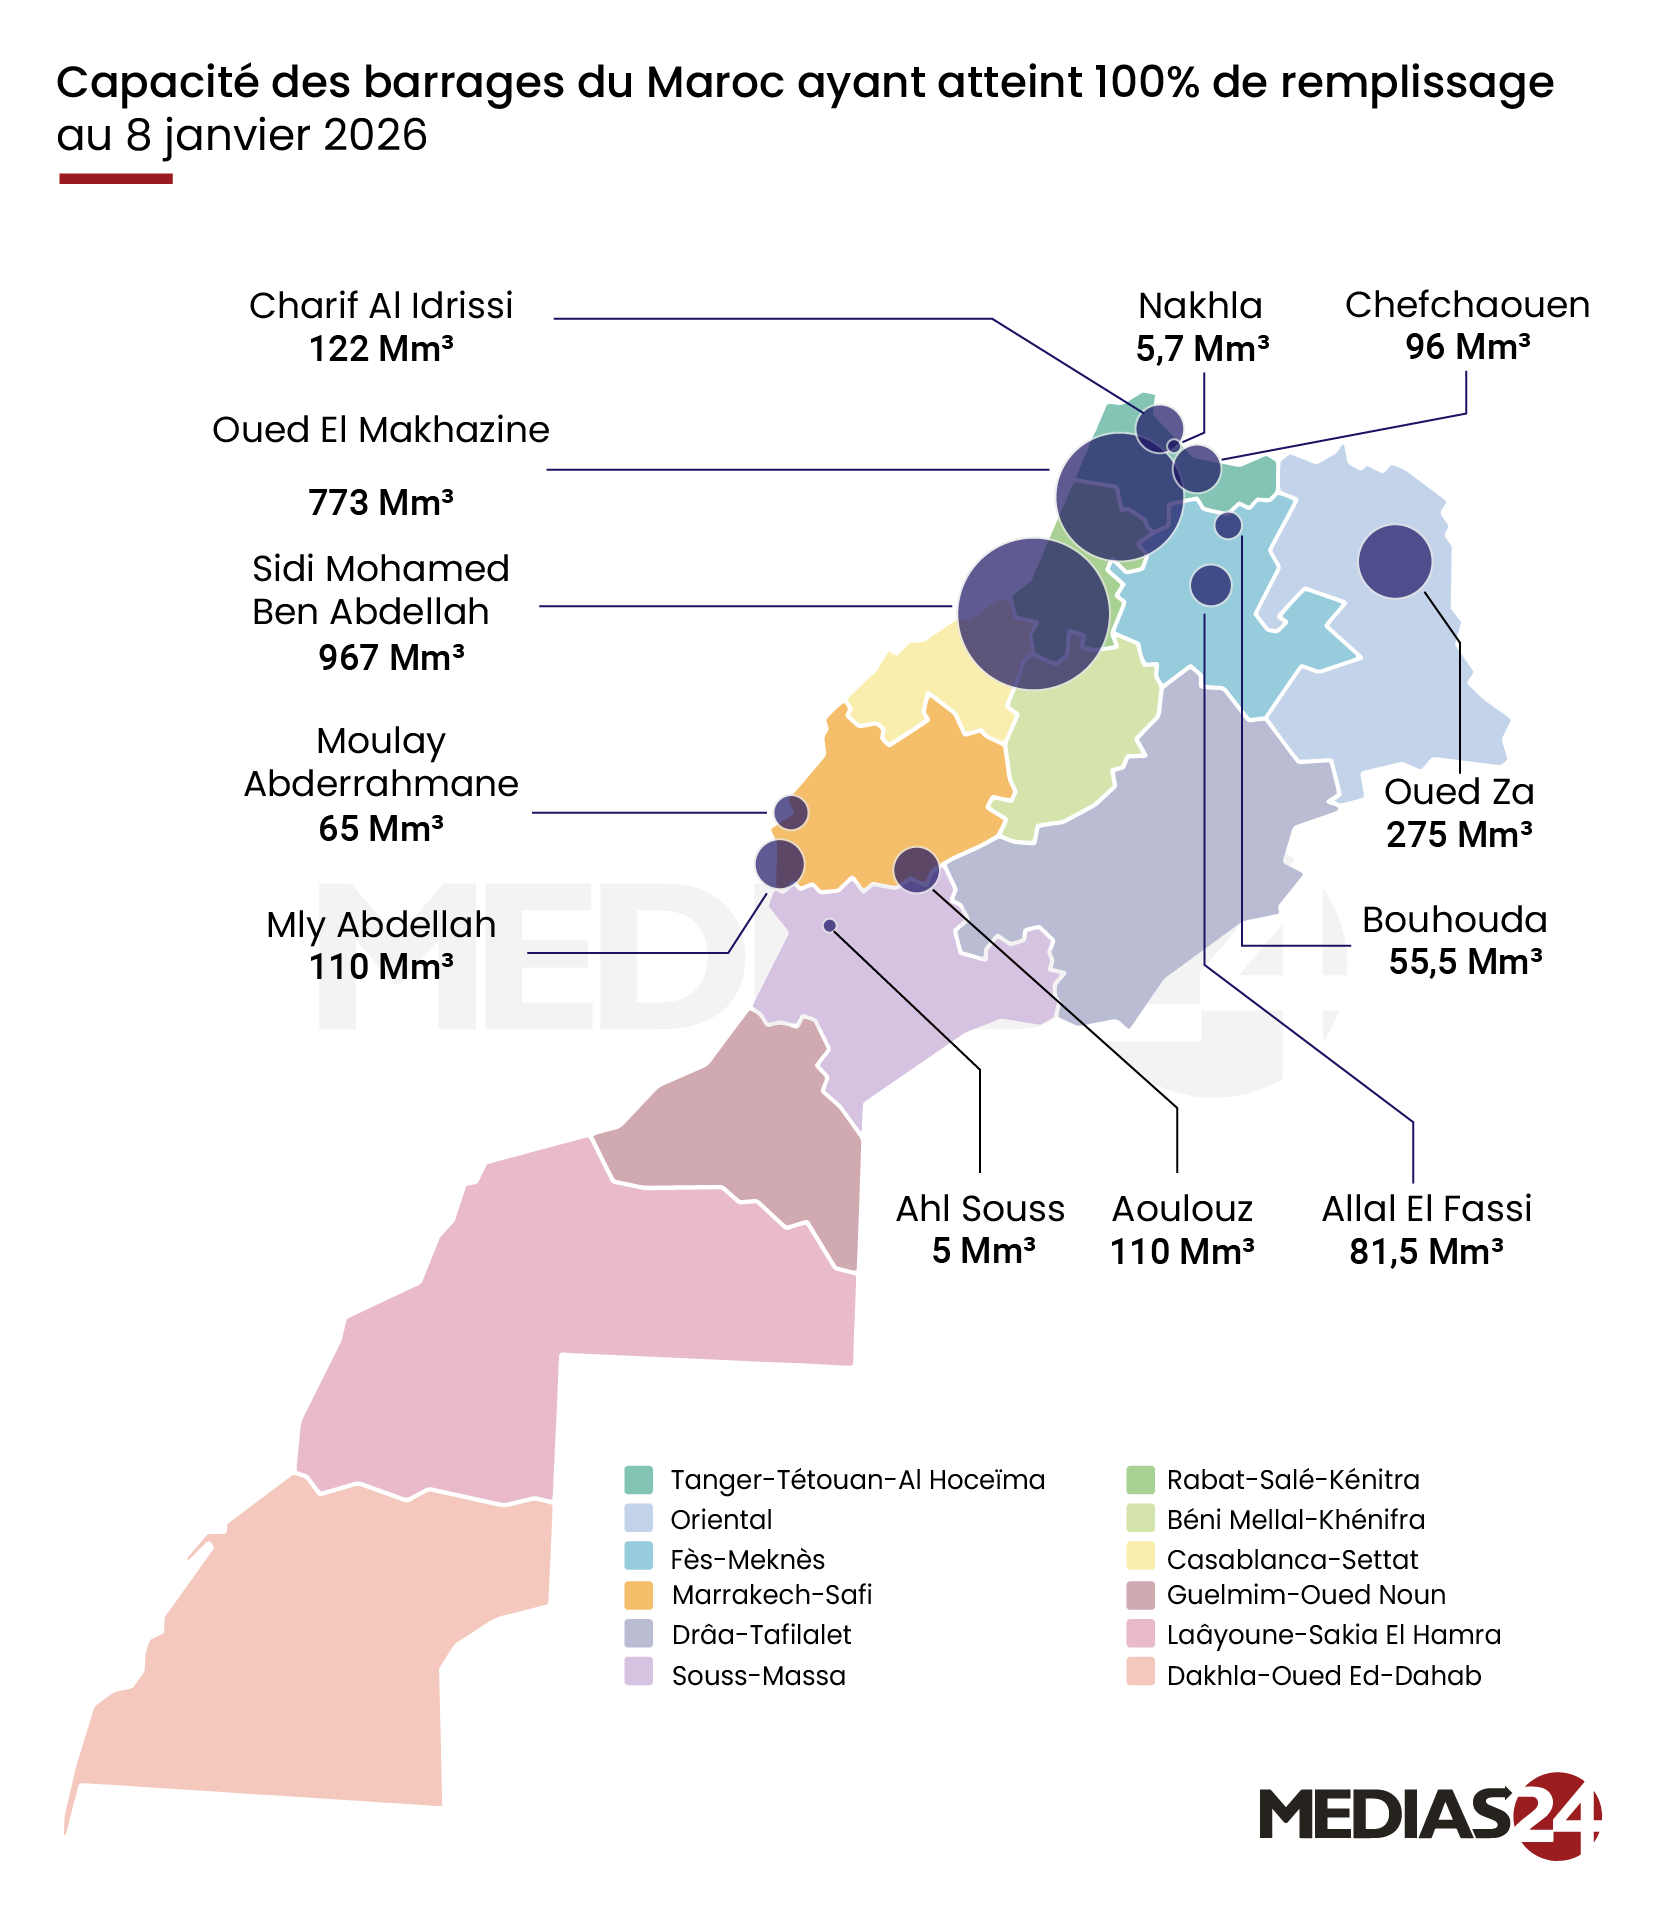
Every reservoir shown had reached 100% on the same date. The circles and labels let readers compare how much water each one could hold.
Flood relief in Morocco
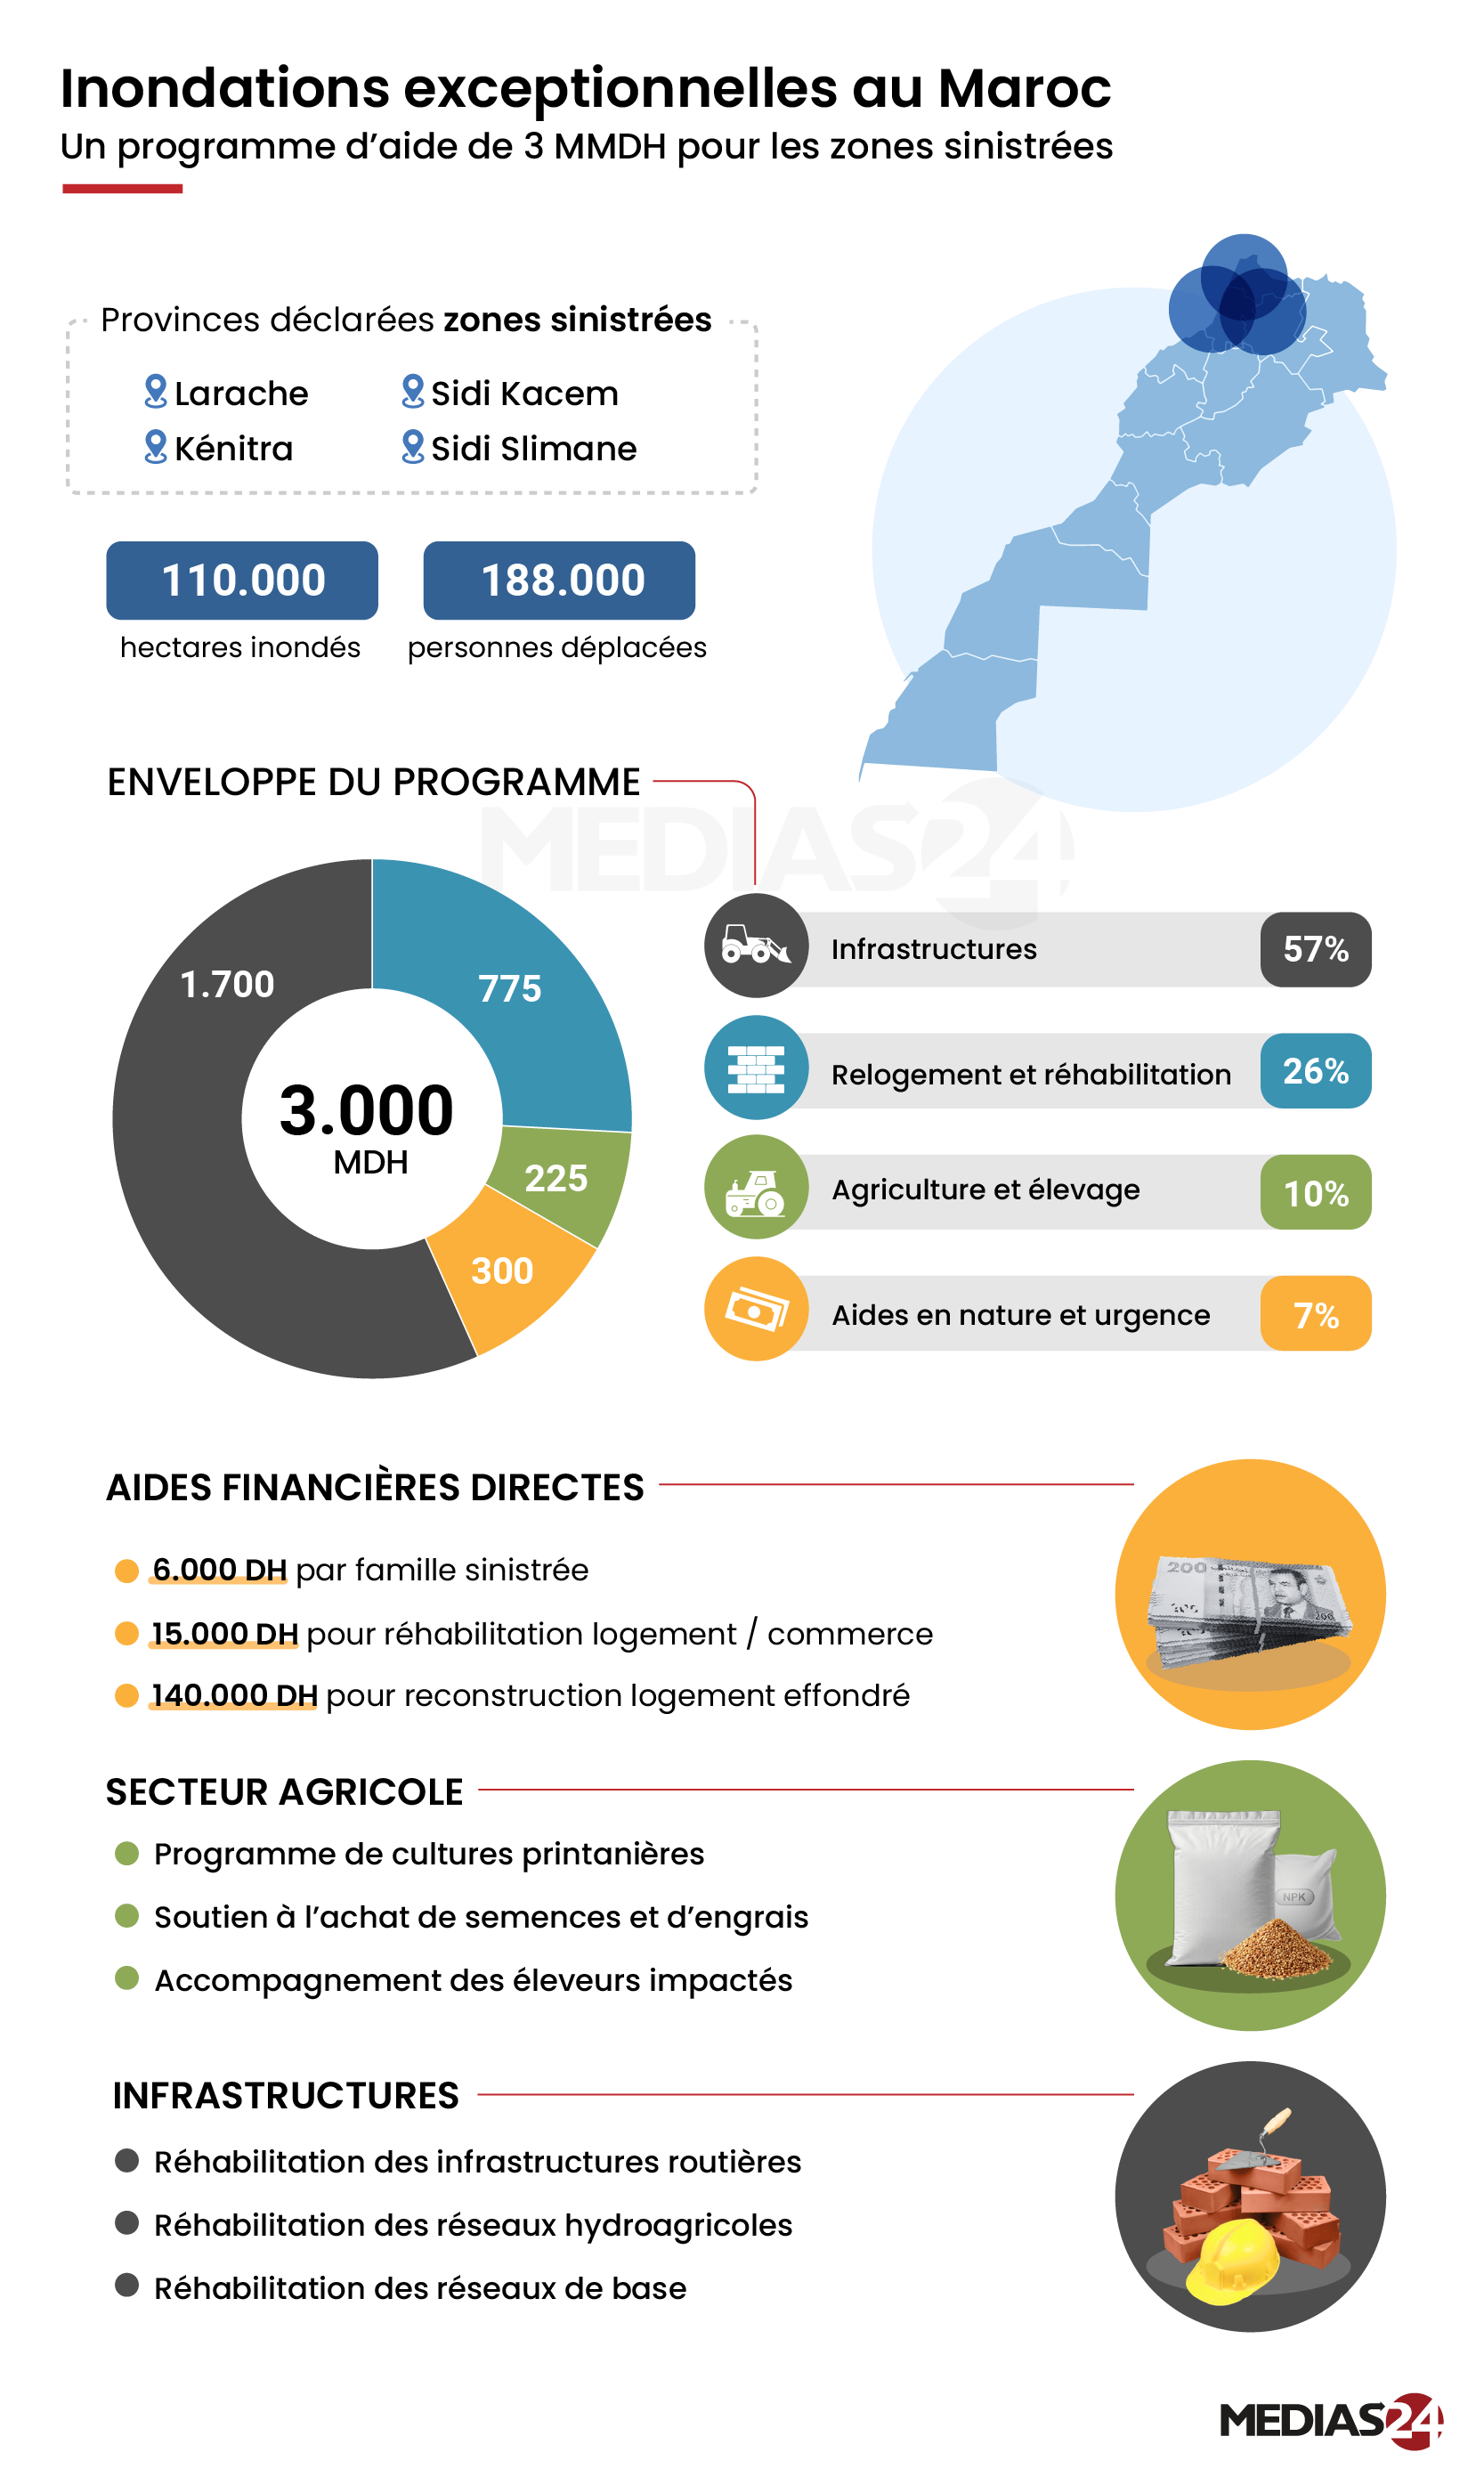
The map locates the four provinces declared disaster areas. Below it, the graphic follows the relief budget from the overall allocation to support for families, farms and infrastructure.
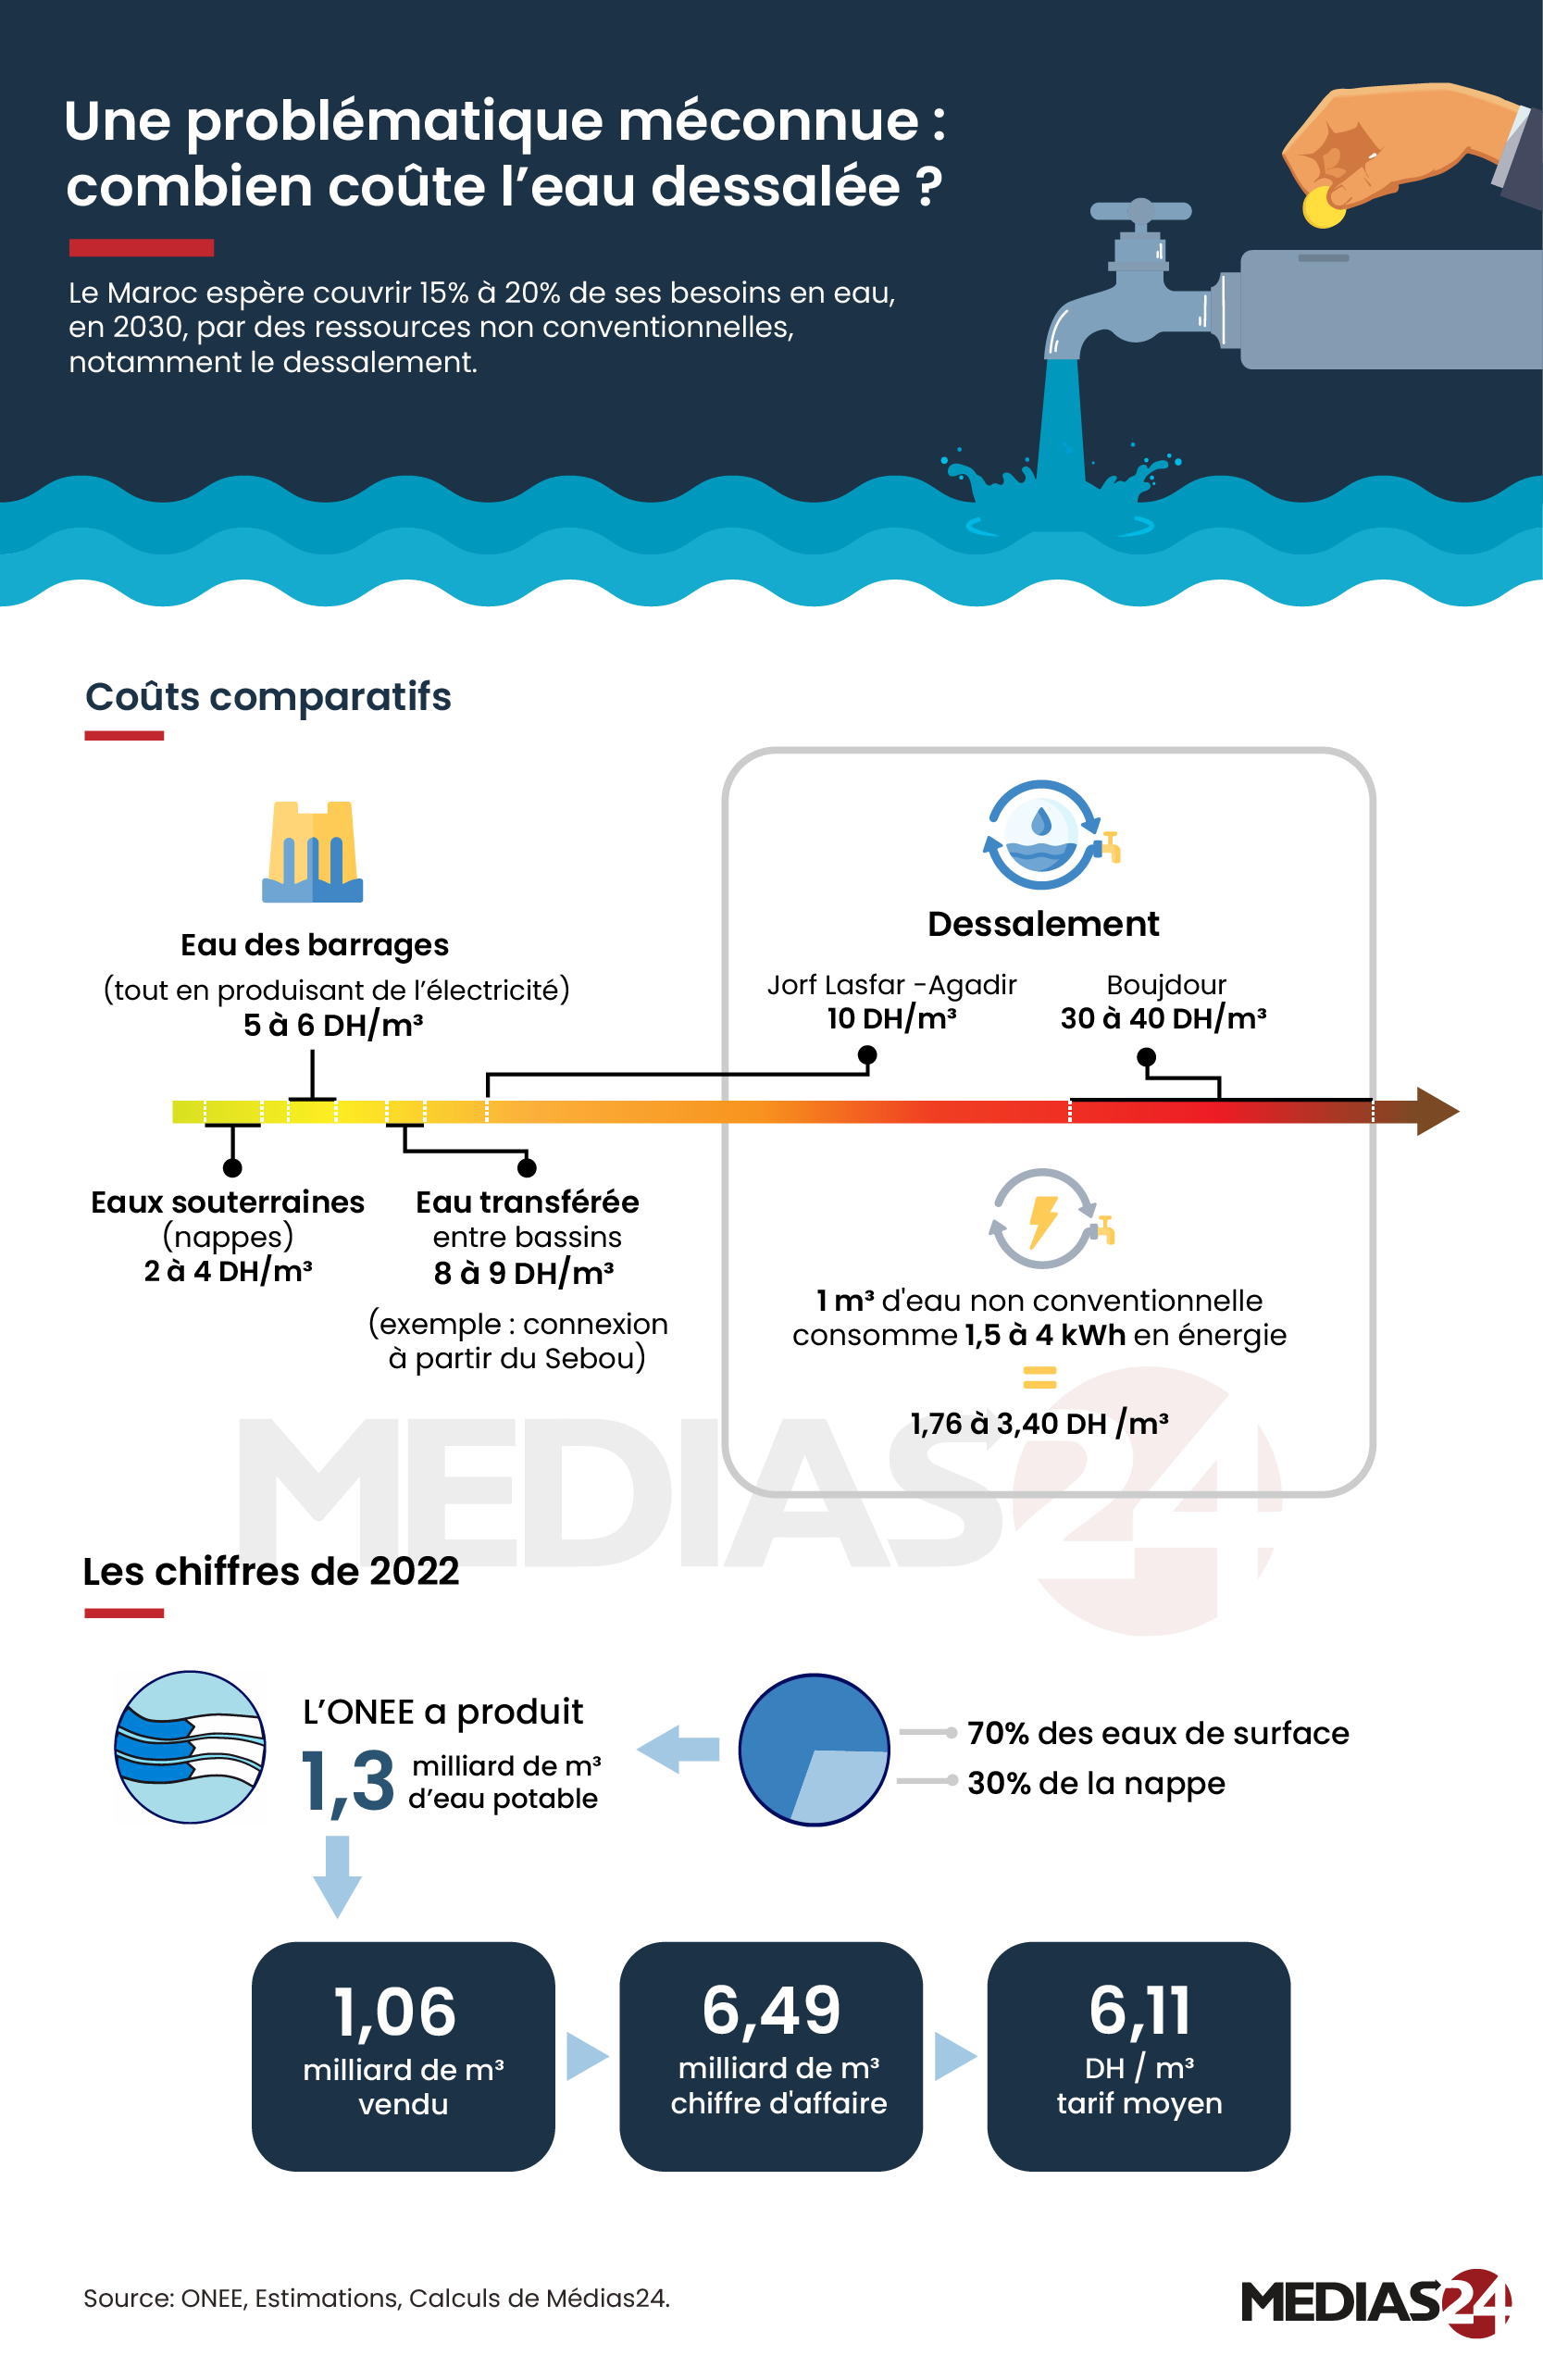
How much does desalinated water cost?
A common unit, dirhams per cubic metre, puts four water sources on one scale. The range for desalination shows how much its cost can vary by location.
Agriculture
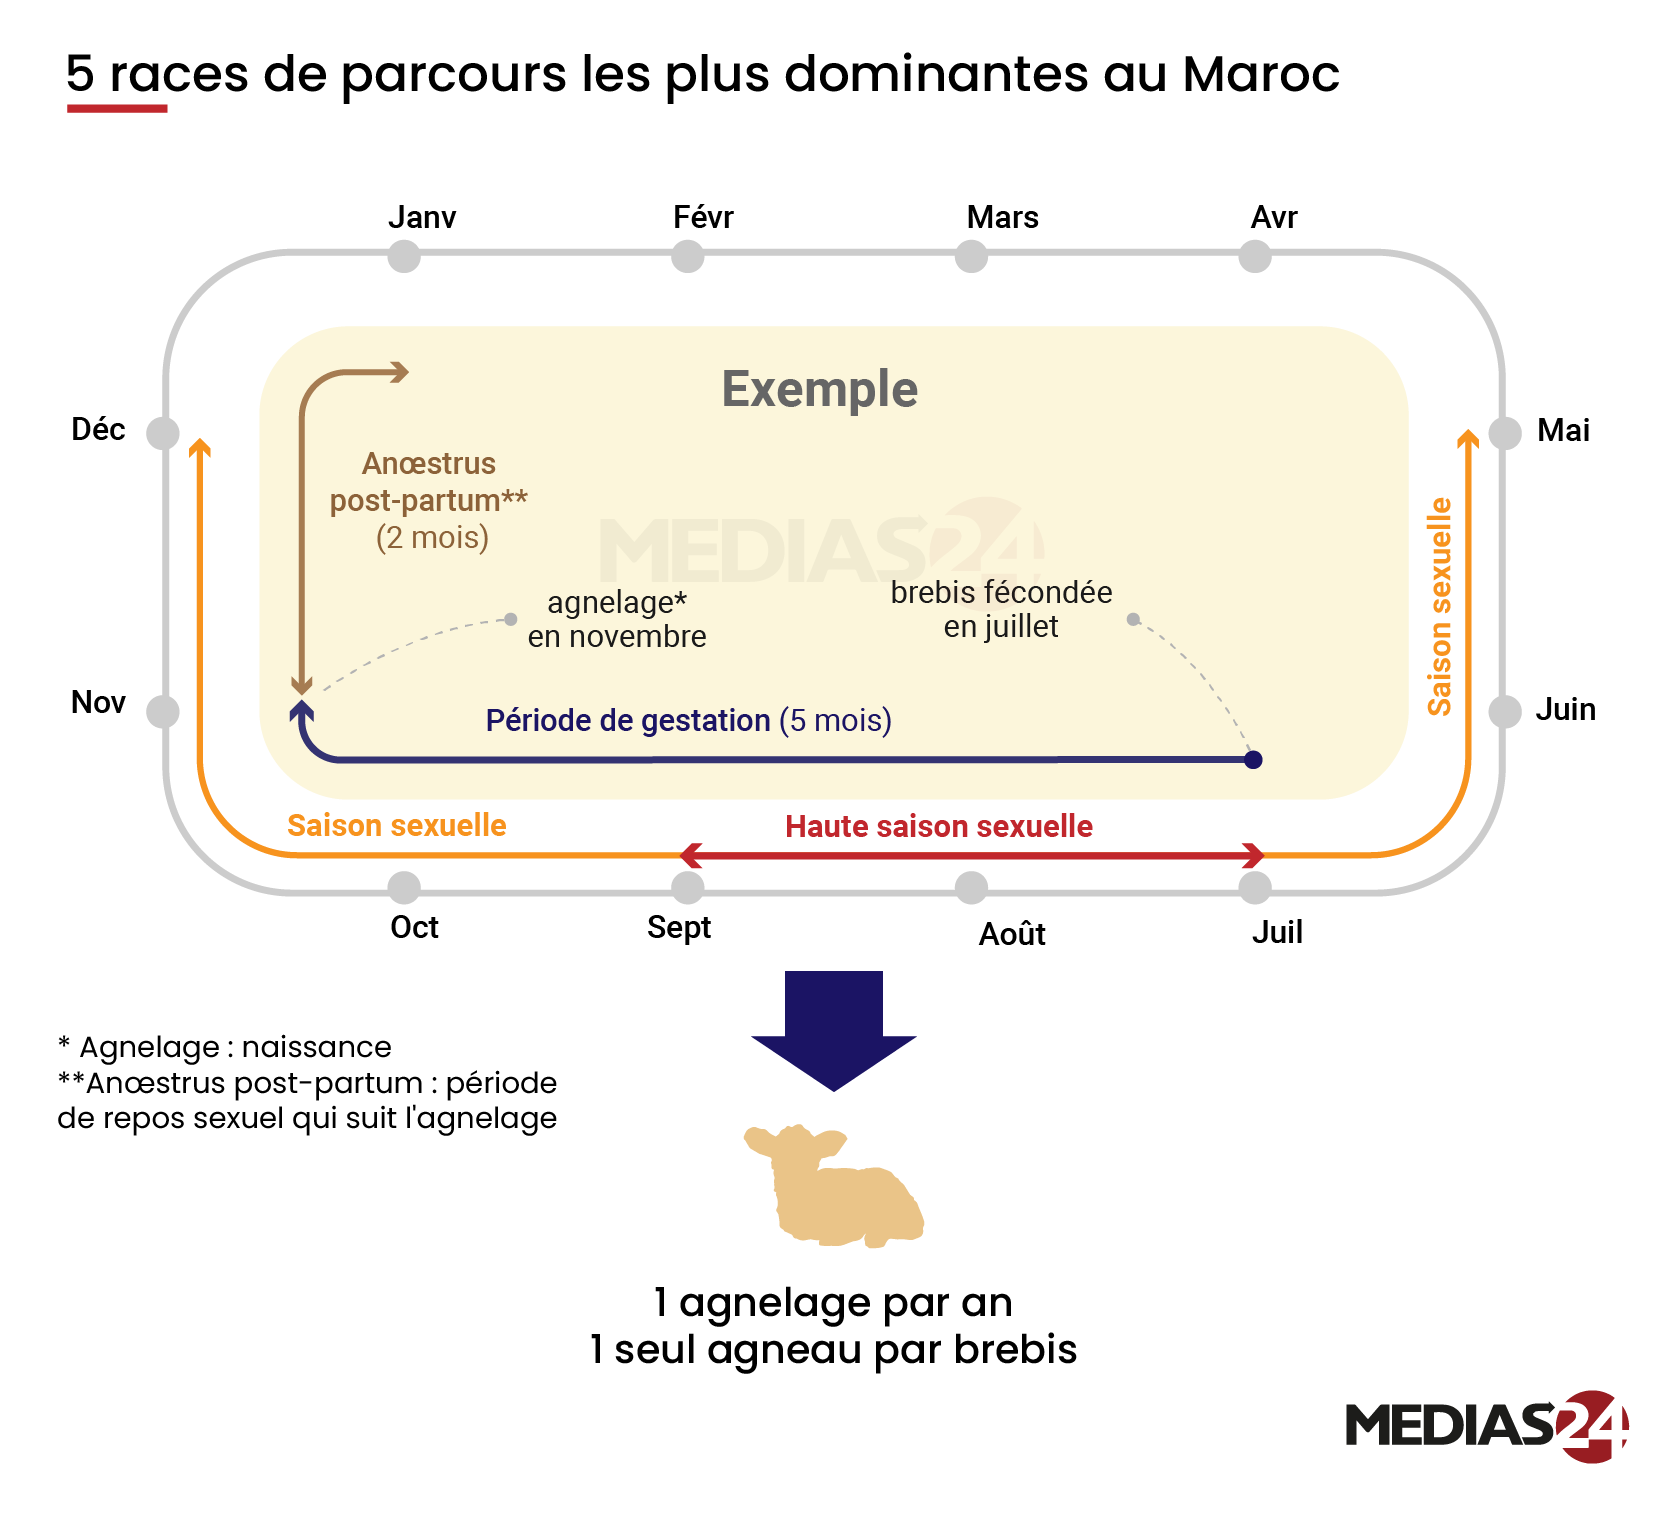
The lambing calendar for five Moroccan sheep breeds
The months form a loop around the page. Following it from July to November shows how the breeding season and lambing fit into the same agricultural year.
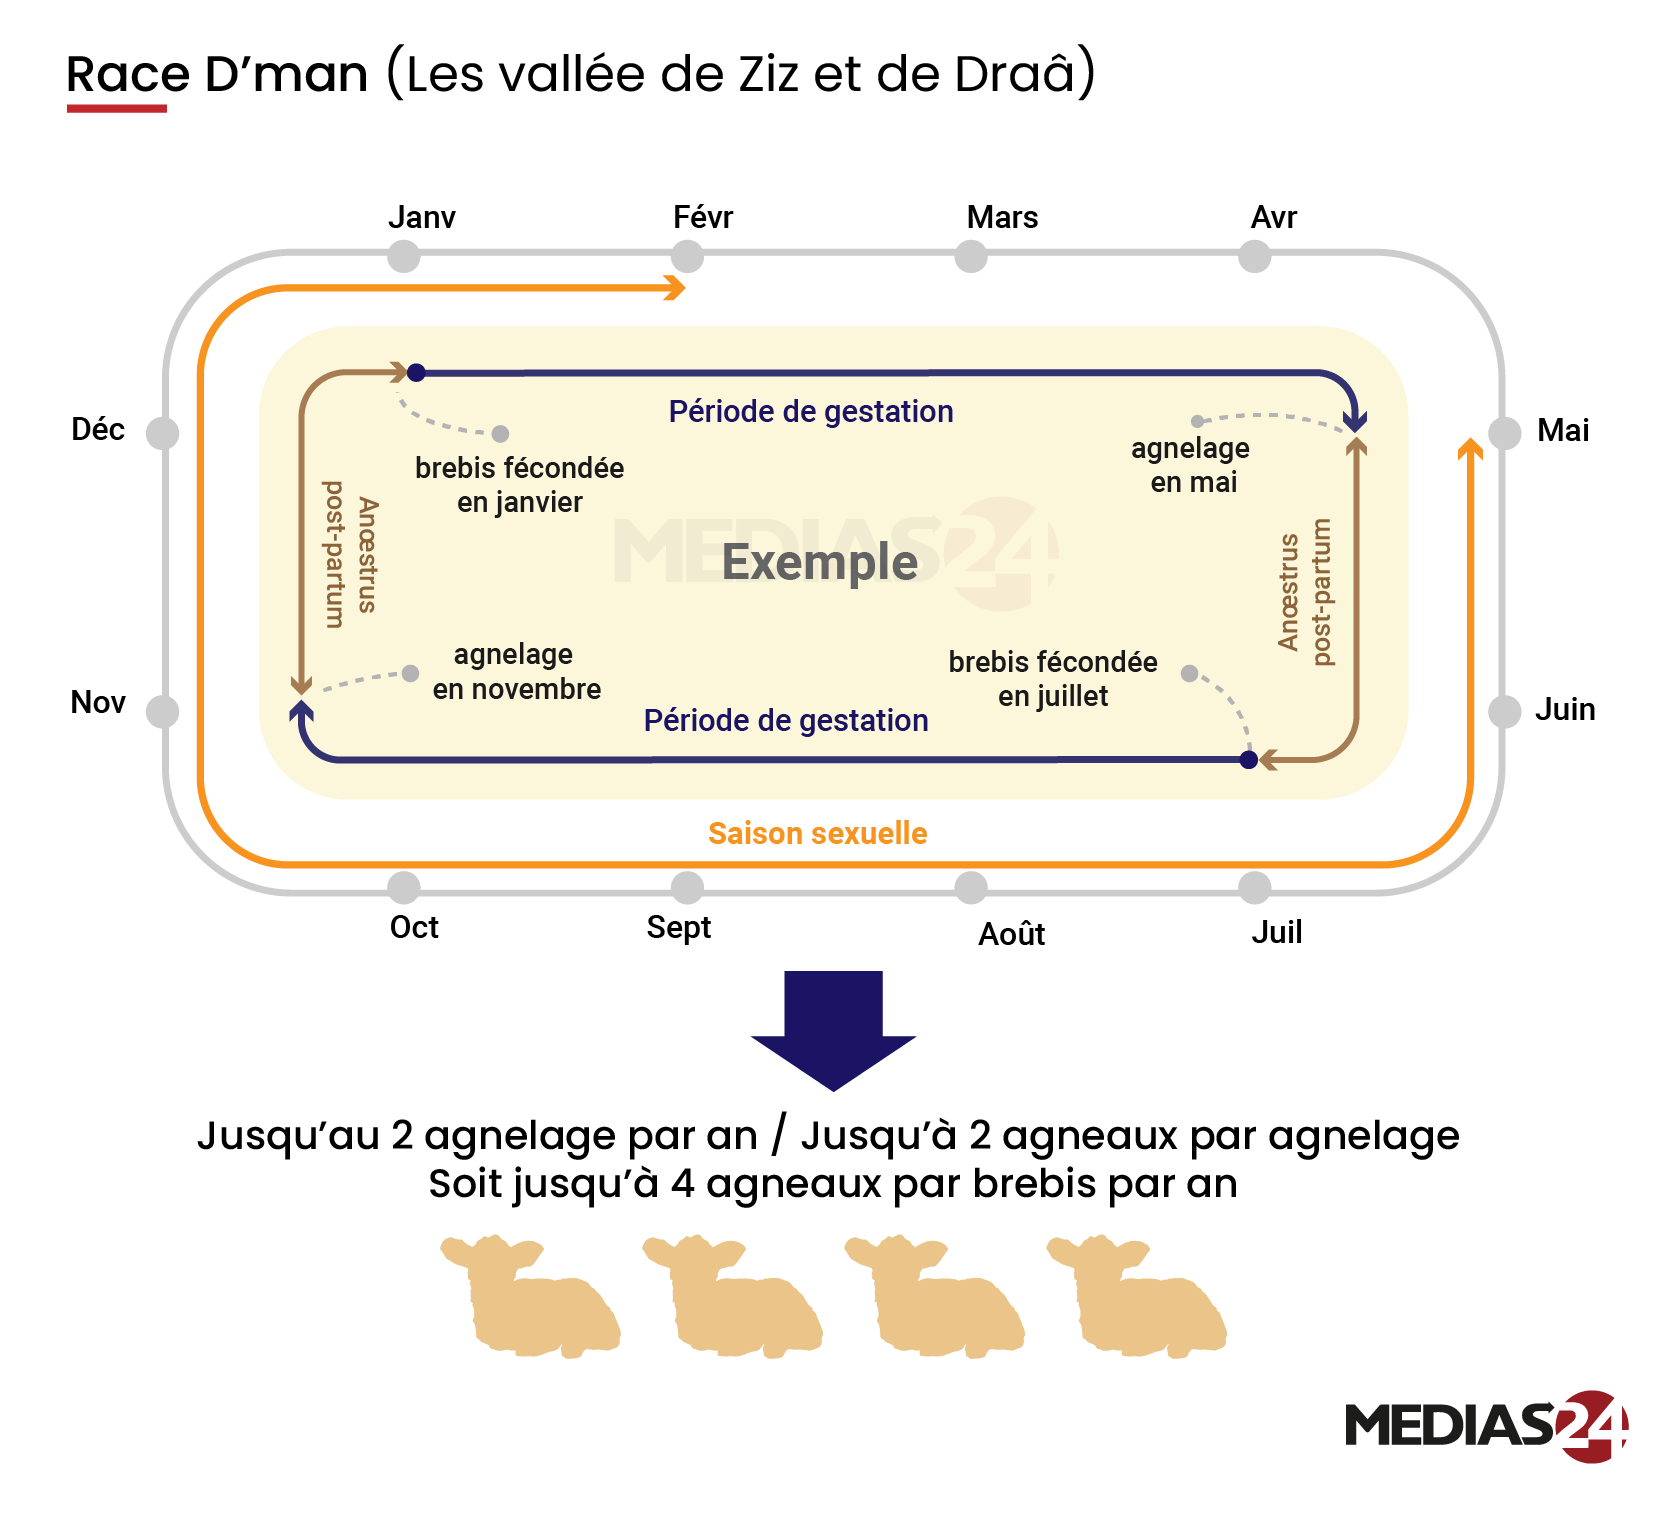
The D’man sheep of the Ziz and Drâa valleys
The same calendar layout makes the difference visible: the D’man example traces two lambings, one in May and one in November.
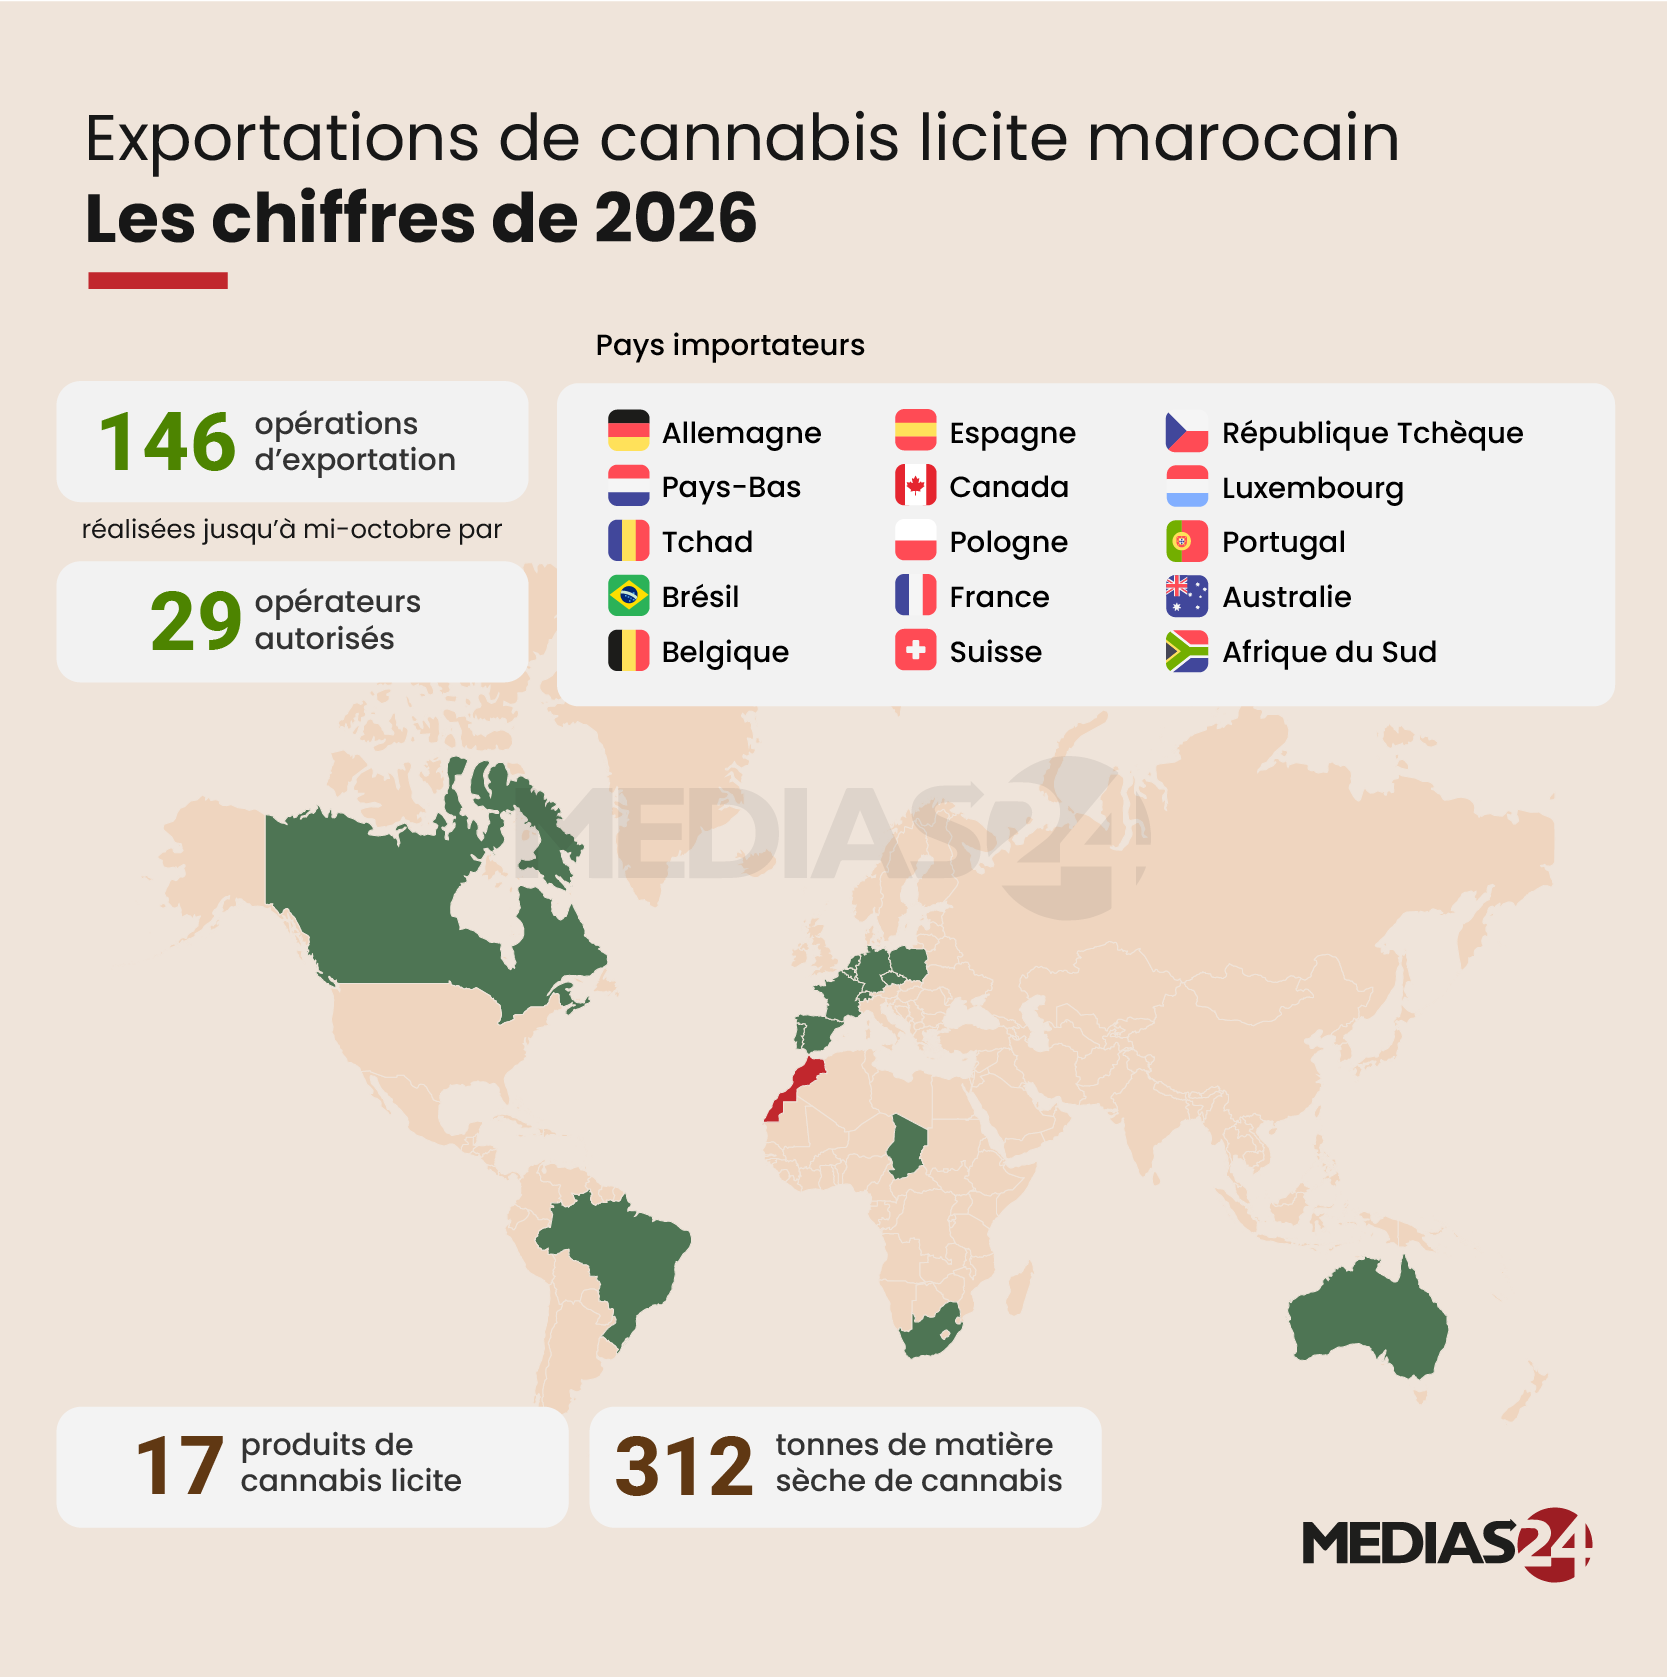
Where Morocco’s legal cannabis exports went in 2026
A world map shows the destinations, while the figures above it distinguish 146 export operations from the 29 authorized operators that carried them out through mid-October.
Defense industry
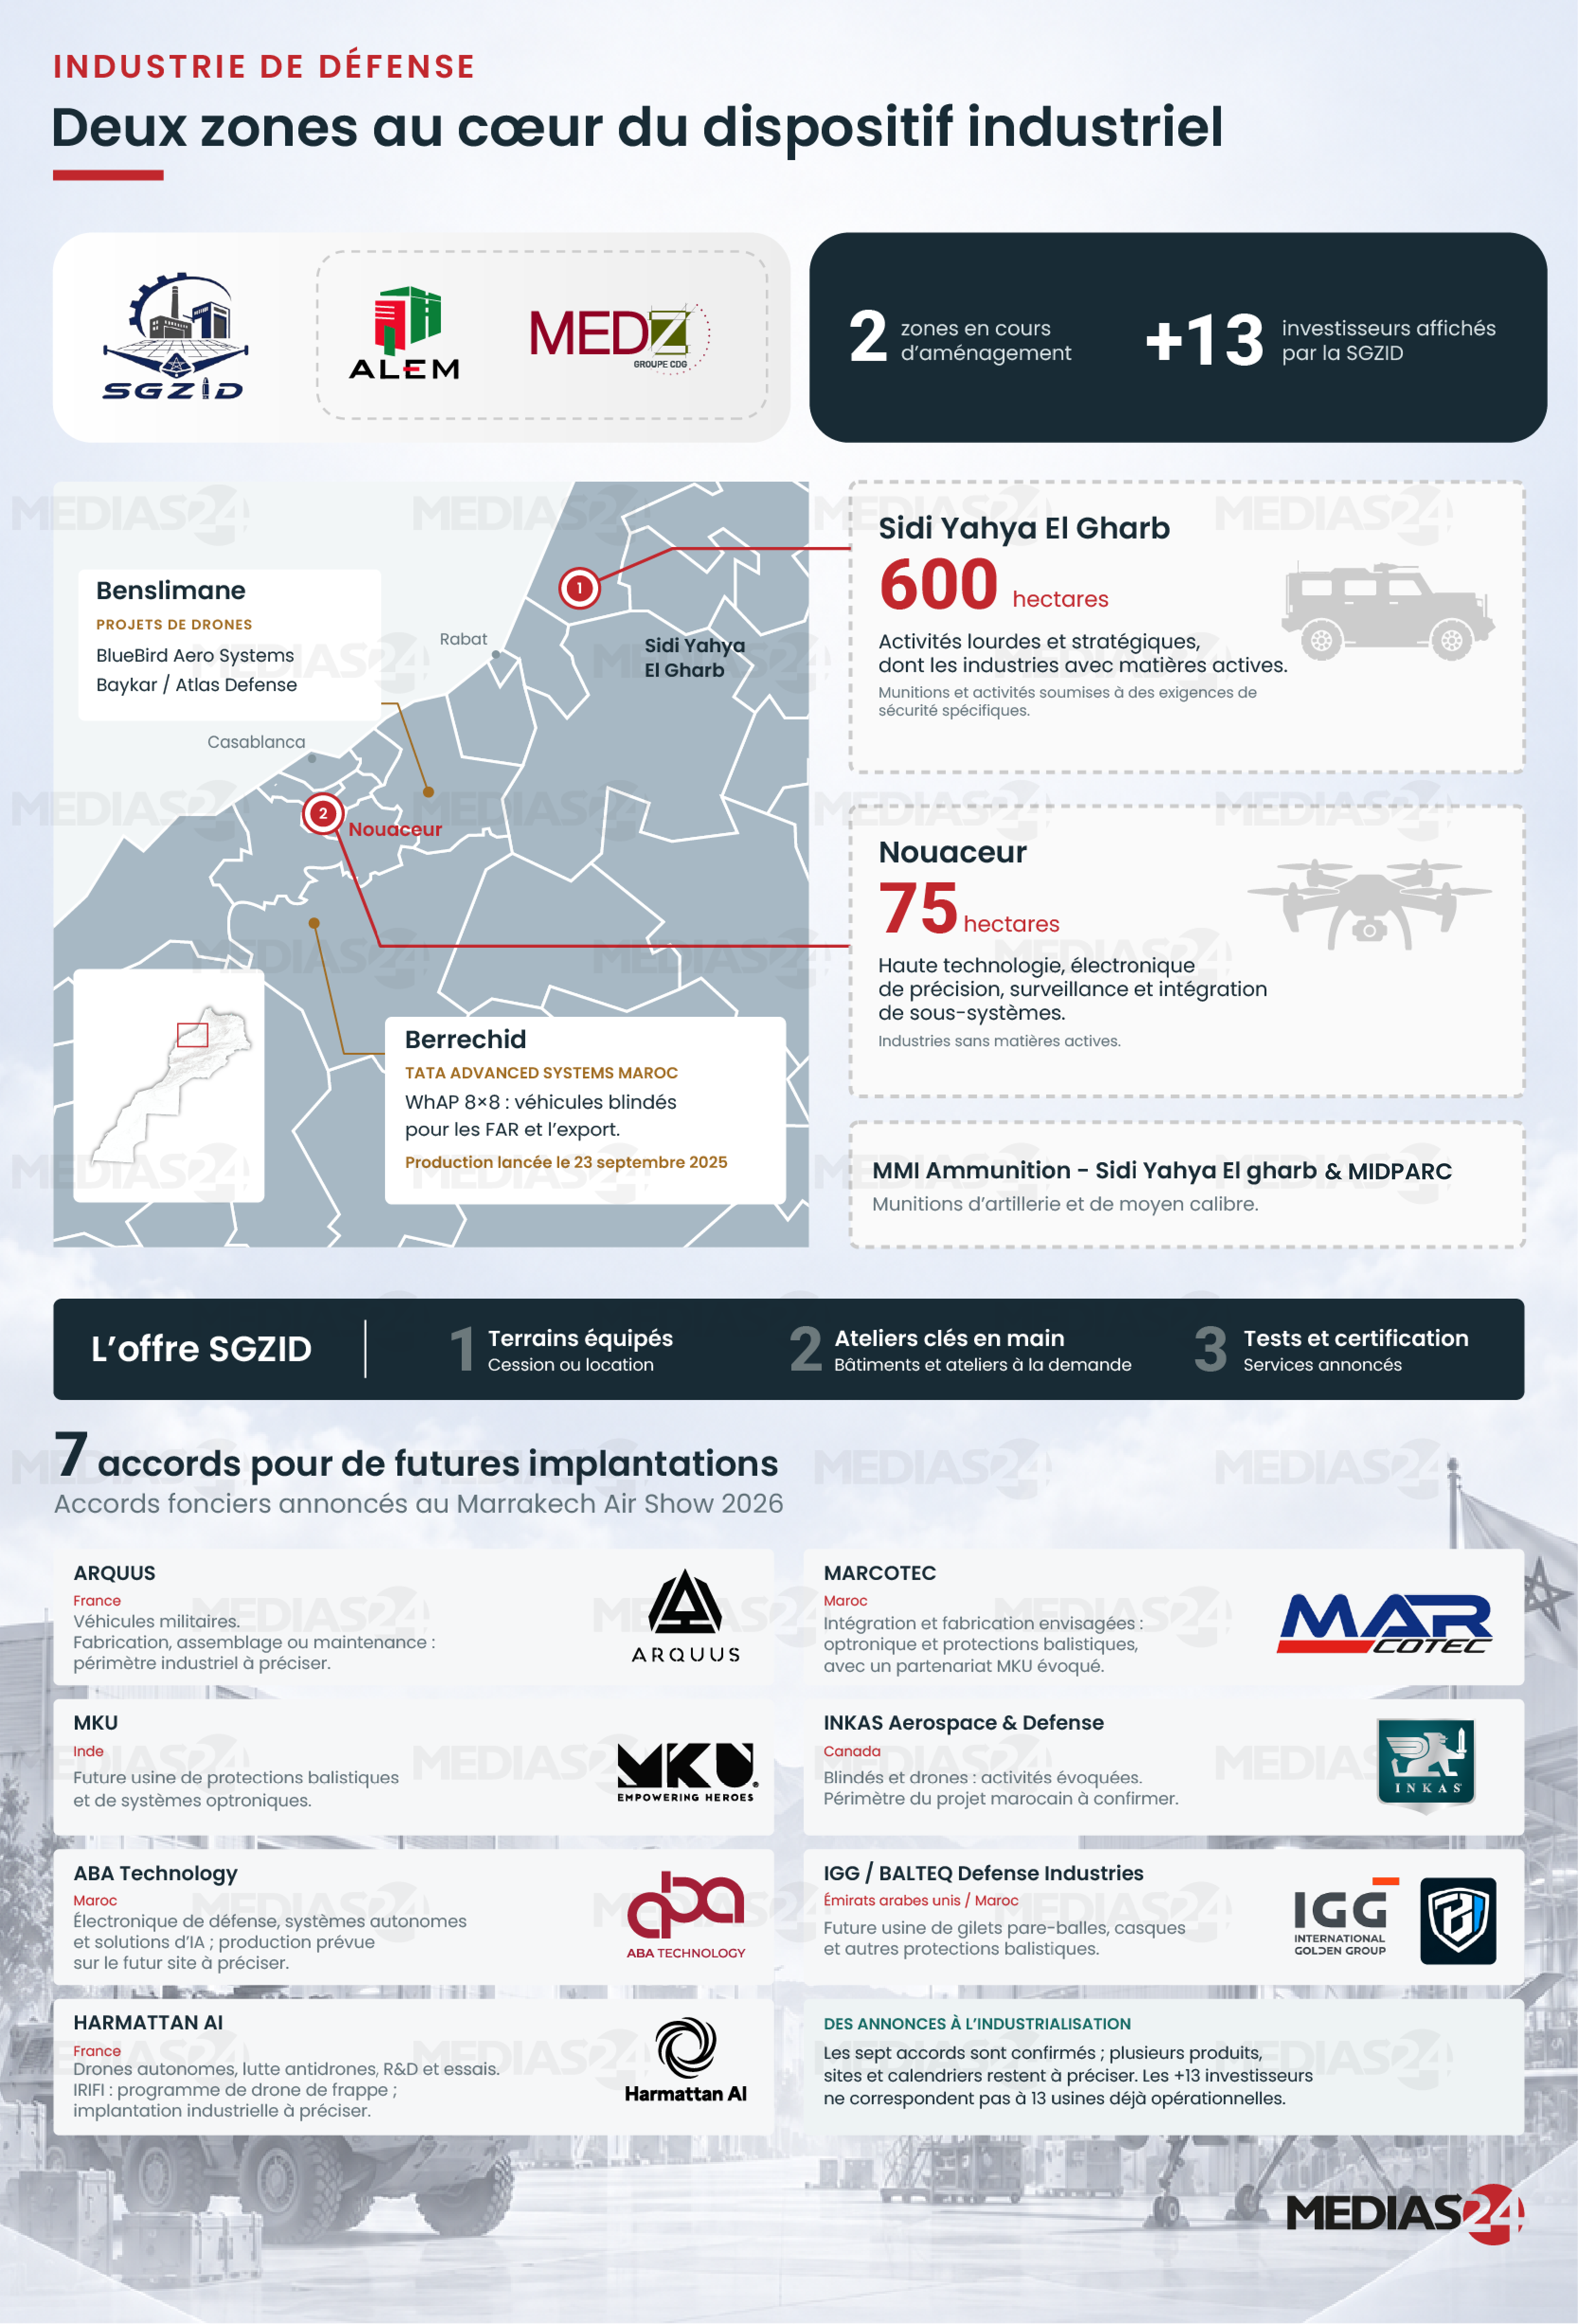
Morocco’s defense industry
A regional map introduces the two industrial zones. A separate panel lists seven announced agreements and distinguishes those plans from projects already in production.
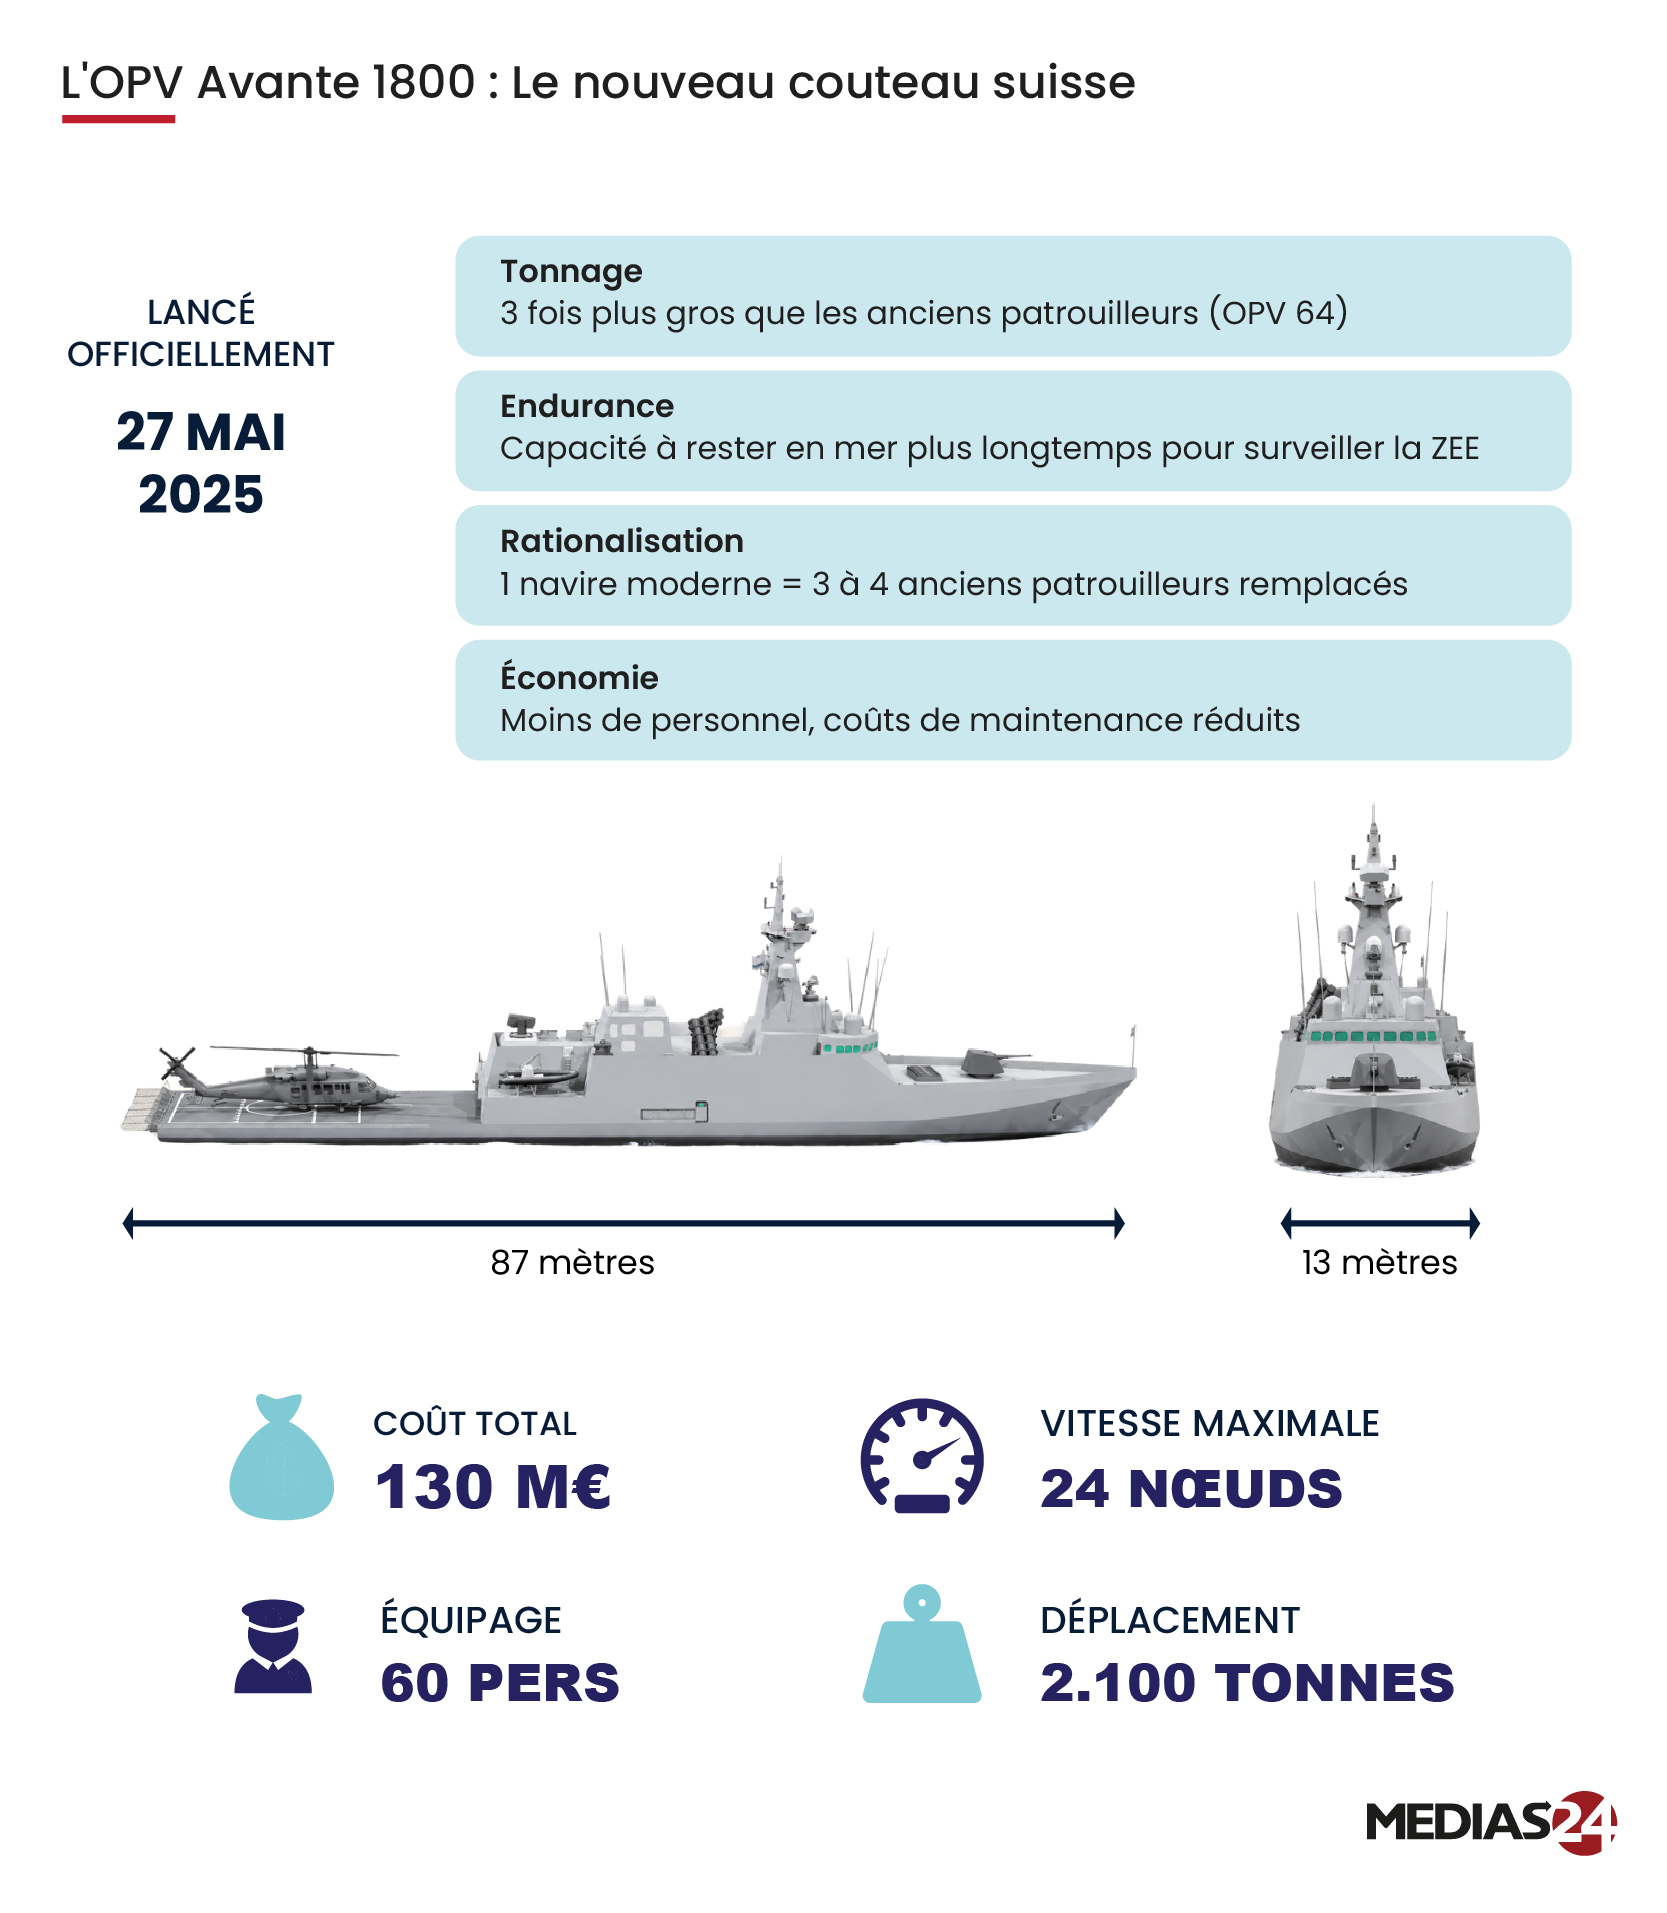
The Avante 1800 offshore patrol vessel
Two views show the ship’s proportions. The figures below the hull give readers a sense of the vessel’s scale and the crew it takes to operate it.
Investigations
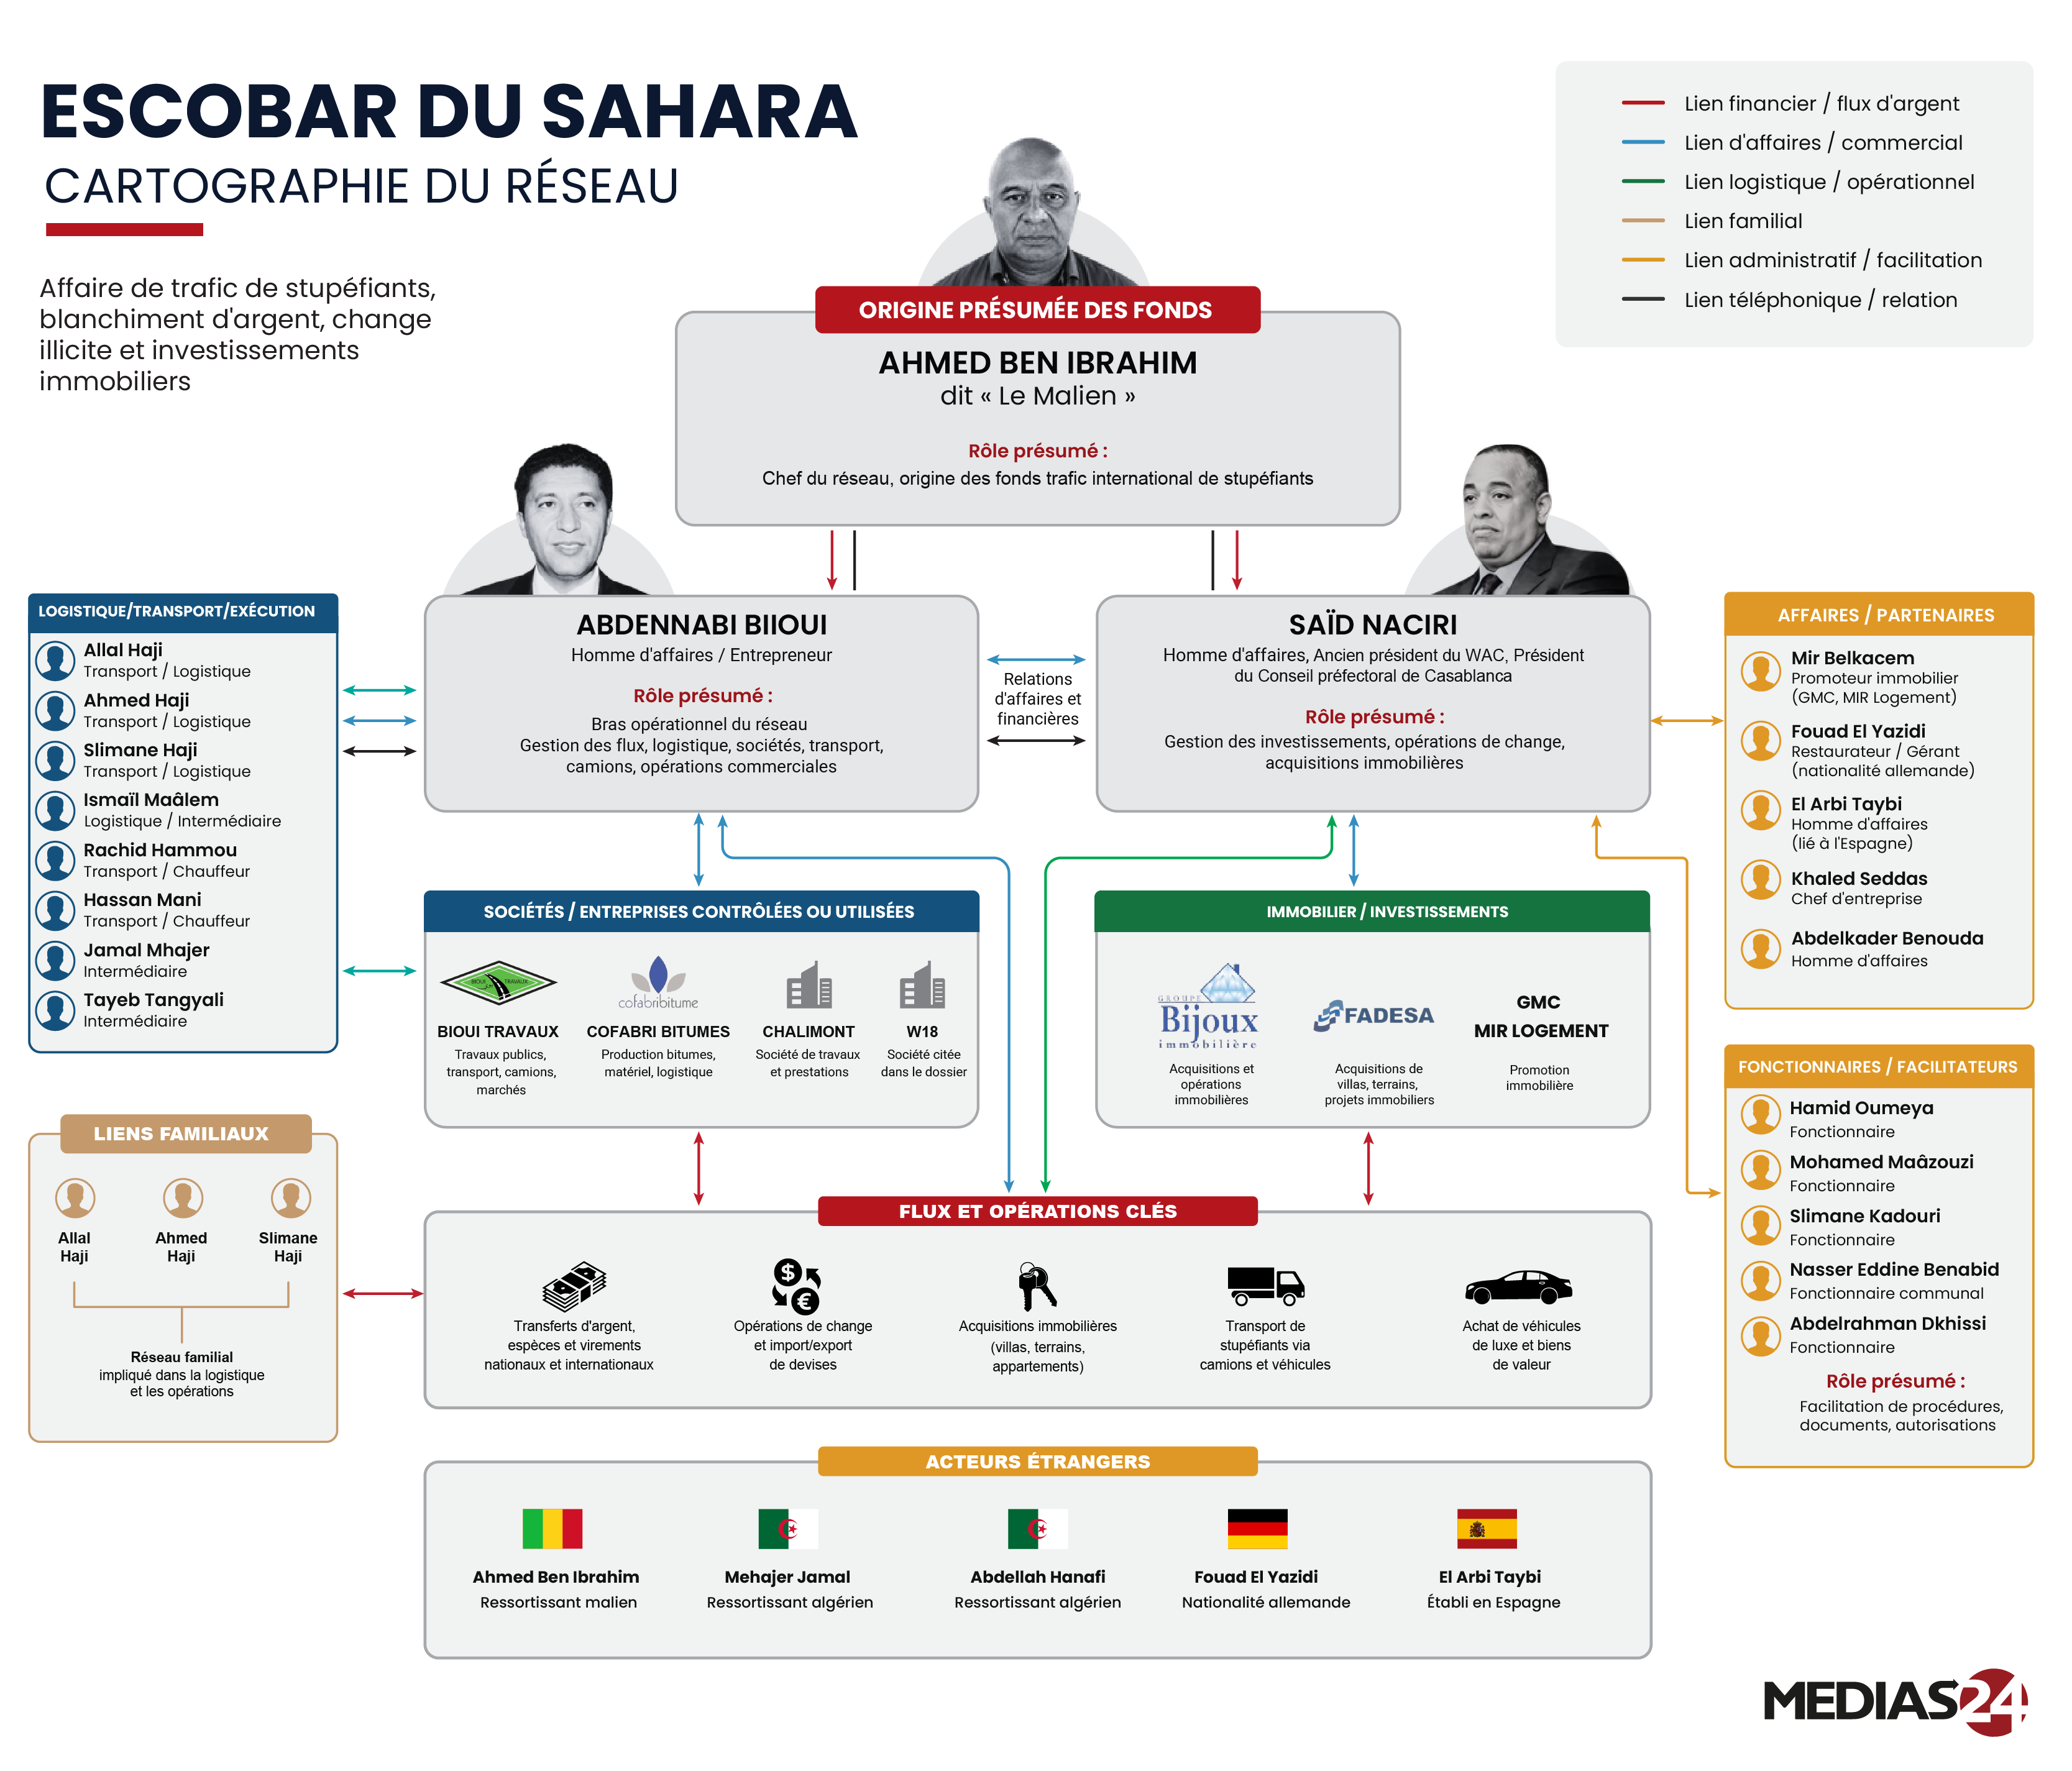
Mapping the “Escobar du Sahara” case
Color-coded lines distinguish the financial, commercial and family links described in Médias24’s reporting. The diagram labels alleged roles as such.